SrPx
-
Posts
2,892 -
Joined
Everything posted by SrPx
-
Affinity Designer V2 getting really slow and laggy after some time
SrPx replied to SKT7's topic in V2 Bugs found on Windows
This is a different problem (different cause, I suppose, too). Super random idea, but have you tried setting "retina rendering" as "High Quality", instead of "Auto" (auto is default, if I am not wrong). The auto thing might be doing its optimization. I mean, in Affinity's Preferences -> Performance. And of course, having in View Quality, "Bilinear (Best quality)", and in "Display", your graphic card (nVidia 1060). (and, yep, I disable Open CL, as it works best for me) . -
Affinity Designer V2 getting really slow and laggy after some time
SrPx replied to SKT7's topic in V2 Bugs found on Windows
In the past, I had issues with type/text lagging (in 1.x, surely would have them in v2 with that font) which I solved by discovering a particular very heavy font (sometimes it's some other odd factor of that font) which had issues with Affinity (just one font). I didn't really used it, so I eliminated that one from Windows/fonts (I also set Windows/fonts on a SSD, as in my HDD would make things go slower in Affinity (I believe even the app start became faster); I still use HDDs for work files and caching ...), and it started to work well and snappy. One thing I'd try is to install v2.0.4 in a laptop or other computer, which would have only basic system fonts, see if then the type tool lags there or if it doesn't. -
Affinity Designer V2 getting really slow and laggy after some time
SrPx replied to SKT7's topic in V2 Bugs found on Windows
Have you tried disabling it? My performance issues (brush lag) went away for ever by disabling it. I can paint in Photo and Designer's Pixel Persona as fast as in any non Affinity app. Indeed, this is so for both 1.x and 2.x (I have both suites installed). The other thing that was giving me problems (while I had been recommending it before, as it did seem to work smoothly at first) was setting "Windows Ink" both in the Wacom panel and Affinity preferences (tools/input method). Setting High Precision, instead, (I advice not to set Low Precision) works best for me in terms of lag and avoiding other issues. Also, yes that card (1060) is now highly unbalanced in features and capability with your great system: it is perhaps being a bottleneck. My 3060 works very fast with the 3900X in Affinity apps -can't complain, certainly- , with very large canvases and huge brushes (probably the GPU does little there, though, but it was definitely slower with my 1650. But because my card upgrade has been almost at the same time than me getting back to using more Affinity, during the time when v1 updated to 1.10.6, and v2 was released, not sure about how much of it can be attributed to a newer card. But even with the 3060, it was lagging before disabling Open CL). It is surely the problems that Open CL causes in some systems. I have not noticed anything slowing down in any of the 6 Affinity apps after disabling Open CL. But maybe it is that I don't use very heavy filters, content-aware tools or etc. I just paint and edit images (but huge ones, for print). I still notice slowing down/lag if I work with live layers while I paint. I tend to rasterize them for that (I work mainly in Photo, also Designer for vectors, but surely the core issues are common). -
Oh, I see. Thank you.
-
Does this mean that "copy as SVG" preference and "paste special- as SVG" produces inaccurate geometry? I'd be worried for other workflows, not just this... I mean, supposedly, nothing should ruin the geometry, inside the software...
-
Frequent Lagging experienced in Affinity Designer V2
SrPx replied to mara.cernoch's topic in V2 Bugs found on Windows
IMO, disable the OpenCL... It works fast, anyway. -
App Crash (All Affinity V2 Applications)
SrPx replied to ProCloud AG's topic in V2 Bugs found on Windows
Also, if I remember well and it'd have not changed in years, VMs don't get direct hardware access to the GPU (there's a method for doing so, though, surely not practical in this multiple installations case). So, while I would test first disabling the Open CL-hardware acceleration (by launching the apps (just once needed, the first time) as I just posted, or in preferences/performance in any Affinity app), if this does not solve it, you might then set it in software mode, setting in preferences->performance "Display" to be "Warp". This should as well discard any issues being caused by the GPU or iGPU/APU or stuff related to it. In regular desktop PCs setting it so makes some things go slower, but it depends on use cases, etc. In worst case scenario, serves to rule things out. -
App Crash (All Affinity V2 Applications)
SrPx replied to ProCloud AG's topic in V2 Bugs found on Windows
If it only lets you 2 seconds, you will have not been able to disable Open CL in preferences in any of your VMs. Please, try running it with the following parameter, it disables Open CL on launch : -
Frequent Lagging experienced in Affinity Designer V2
SrPx replied to mara.cernoch's topic in V2 Bugs found on Windows
I notice lag in painting (I use very large canvases and large brushes) if I have set several "live" filters/fx etc layers. With just simple pixel layers (even using many) and nothing live (I don't need it for painting, or I do whatever and then rasterize) I don't have lag. I have this paranoid obsession with the default number of undos (in preferences/performance) being excessive, 1024, as that did cause performance issues in very old versions of Photoshop (I set it in Affinity apps always to 30 - 70). Also, most problems I had of it not being snappy did vanish by setting Open Cl/hardware acceleration off (but setting there my nvidia card, not Warp). Some other slighter issues have gone away by not using anymore Windows INK in both the Wacom panel and the Affinity preferences/input method. Setting there "High precision", instead. Surely has helped curing all the graphic driver/.NET/win updates/sfc & dism cleanup. But for sure I know that if I set Open CL on, I get lag. So, it's off, in all the Affinity 2.0.3 apps, and goes fluid (at least here) with very large canvases and large brushes, after doing those things, specially OCL stuff. Also, I have 32GB RAM. Not sure if there's also a problem with people with 16gb or less. -
Fonts conversted to curves unable to merge/add
SrPx replied to darkcrowgraphics's topic in V2 Bugs found on Windows
@darkcrowgraphics as I just wrote in other thread (and some others, longer ago) it's a bug with text converted to curves, and it causes problems to booleans (add, subtract, divide...), shapebuilder and knife. There are two workarounds. 1) One is setting all document (in document properties) width to 1px, doing all operations with booelans, shapebuilder or knife, then set in document properties the width to what it was. or 2) And the one I found out (also for booleans, shapebuilder and knife), set 'copy as svg' in preferences->general. Leave it permanent or not, as you prefer. Do a copy of your curves (converted from text) with ctrl+c or right click, 'copy', then, top menu Edit/Paste Special, then "paste as Scalable vector Graphics (svg)" (advice: make a preference shortcut for it). Get rid of a layer or group that it generates, and place with snapping the new curves object to snap to the old one, to get it in same position (no needed if it pasted in-place). Get rid of the old one. I just detailed it better here. It's very fast to do. I have not tested much the first one, but yep a pair of times, and it worked. I suppose each is better for different cases (ie, not willing to use the copy as svg preference or not willing to change temporarily the document dimensions, but I don't see much issue with any of the two). Edit: When using several letters, I would recommend using right click-> Geometry-> melt, as it combines all curves into one single object/layer. -
If you set in preferences/general to allow to "copy as svg". After that, all you need to do is first convert to curves (as usual) your text , letter, glyph or etc, then you can do a geometry/melt -if needed- , copy the curves with ctrl + c or right click->copy, (but the actual curves not a "group"), then menu Edit/Special Paste, and choose Paste as Scalable Vector Graphics (SVG) (it generates a group, get rid of it (ctrl+shift+g or right click->ungroup) or pull the curves out of it). I have set in preferences/shortcuts a key shortcut to use it instead of regular ctrl+v (only when needing to "curate" a curves object), for the sake of speed. Which is the only real difference to a normal workflow. You can leave the "copy as SVG" preference permanent, some people do it as they are frequently fast copy & pasting among apps like Inkscape and Designer). So, the difference with a normal workflow is that you are making a copy of your converted-to-curves text, place it over the old one (using snapping on as it places it exactly in place, then get rid of the old, of course). It's all done in 5 seconds. From then on, no need to make it to the object anymore, can do then any boolean, knife or shapebuilder operation to it. The object is permanently "curated". It's a workaround I found till they fix it. But it works for now with this issue, workaround that works to be able to use without this and other issues : booleans, shapebuilder and knife. But in other threads I can see that a few people don't realize yet that it is related to the same bug. Note that setting in preferences ' copy as svg', it takes it on or off without needing to restart the app. You can change it on and off as you wish during your process.
-
Yep, I think so, too. You select a new brush and then you will be using that one. But there might be a small bug. [ Off topic: You can (double click on any brush on the list, to permanently set its properties and behavior) link a tool in such settings dialog/window. In the "general" tab, last drop-down item. If you click to deploy that, you can set what tool gets triggered just when clicking on the brush of the list. IE, if you want a brush for cloning (you can have several for several ways of cloning, etc), you can do so, and clicking on the brush on the list will swap you to clone tool, in your cursor. Now, is not exactly what you asked, but might help you to make a workflow that works for you. ] But what you mention might be a bug. Sometimes, when selecting a new brush from the brush list, it does not take the new brush, you keep painting with the one you were using before clicking another. This gets solved by just clicking again on it, or several times (just not as fast as double clicking, or you'd trigger the brush properties dialog). The bug happens rarely (but often enough to replicate it in 2 minutes), often when having painted more than one stroke. And is (temporarily) fixed how I said.
-
Crashes caused by Affinity Store Brushes
SrPx replied to paolo.limoncelli's topic in V2 Bugs found on Windows
Yep, I believe is the stroke preview (that's why the show as list disabled works). I can't remember now, but I don't know if it was in the Windows Events viewer, the actual dump file (with a debugger) or the logs, where it indeed specified the brush preview as a problem (made me think of disabling that, indeed). -
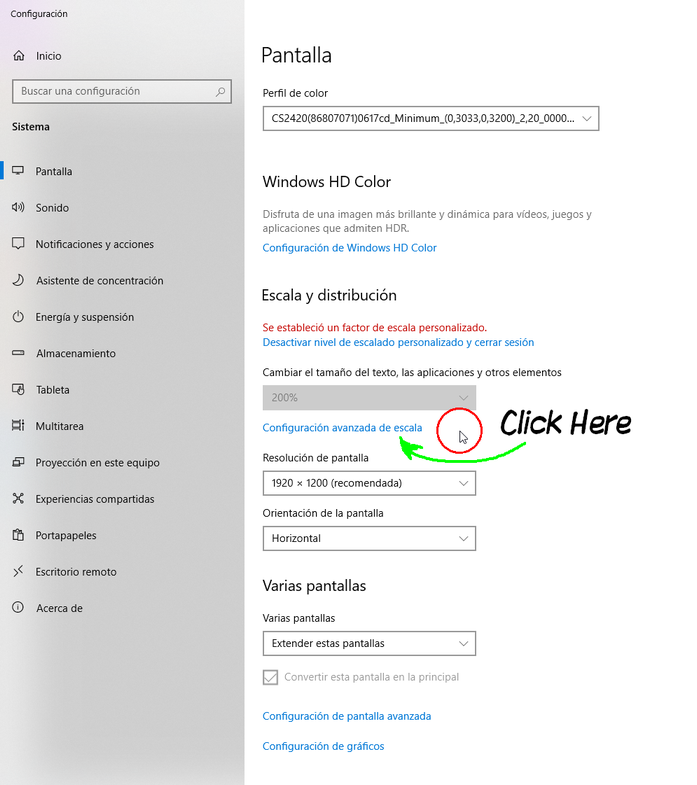
Recently another user had this problem. He solved it by using a different scaling. A lot of people think (maybe this is not the situation, but just in case) that you can only set Windows at 125% (yep, needed for a lot of laptops) and 100%. You can use "custom scaling" and set it at 115%, 111, 109, 120, 140 etc (btw, I tested all of these to work). Just, personal advice, don't use 102% or 110% . At those very specific (hopefully it's just those) scaling factors I discovered it crashes when double clicking the foreground/background color sample circles if I set at that DPI (don't know why). The ones (and surely any other number) I listed above work. Another users (actually, I believe 2 users) confirmed to solve the problem with 120%, and 115%, in their case. It's just clicking a blue link ('custom scaling/DPI' or 'advanced scaling', I think) below the place where you set your Windows scaling (in Windows Settings -> System -> Display, scrolling a bit). Screenshot below, sorry for the Spanish, but it is in the same location and items' order. Then you are carried to a new screen, where you type a custom scaling factor. Maybe 115% or 120% will suffice to show the button (and similar situations), but you might need to try several numbers until having one scaling factor that makes you most comfortable. It's often needed a Windows restart (reboot) after setting the scaling, to fully test it, though I have been able to test it without restarting. But to be sure it is taking it, it's best a restart. I'd try first 120 and 115, or anything in between, etc.

-
It seems it is having issues to load the Wintab driver. Is there a chance that the pen tablet service would be down? (in Windows Services). I would check that the very first. Secondly, if unable to solve anything by that path (specially after restarting Windows) , you would still have the option to use "Windows Ink" (typically in "projection tab", in the Wacom panel, surely similar with other brands) , for that app's profile in the tablet panel. Or in the generic options of the tablet panel, if you don't customize per app. And then, of course setting Windows Ink as input method, in Affinity's preferences/tools. Heck, might even work setting Windows Ink, and then back to "high precision" (what I am using right now, for other reasons, this is my new favorite). As it might "revive" the situation with wintab. But probably won't, if the tablet driver's service is down for some reason. A complete uninstall of the tablet driver, and re-install with a recent driver (for your specific tablet) could be a good way to address the situation. Now, how this could affect "edit in x Affinity app", no idea. Probably it doesn't, it just might be two separate problems (or not). Edit: Indeed, it appears that is not finding the paths... I don't know if this happens if you moved after installed the apps to a different disk/drive. I myself tend to address these issues by fully uninstalling the 3 apps and installing again.
-
I believe embedding fonts would anyway require the font(/s) license in the target system, specially for the product's commercial usage, but don't quote me on that... I would have to agree that the font embedding is ideal for certain cases. But I have found the situation (many times) where even before sending a first file, the print company would set the requirement of all fonts being converted to curves ("outlines"), despite being a PDF (specially, those print places of the hyper cheap kind). The best workflow for quality is "packaging" the print job (in InDesign, you can do that), where not only the font but other matters will get packed. Outlining the font (converting to curves) can make the text lose a bit of quality (it thickens a bit, kerning might change, etc), and you lose certain features that an actual font provides, even just as a product for display. Anyway, for editing in the target system, it's more usual in the industry to provide an AI or EPS, but because it's Adobe's format with Adobe's tools (fiercely protected walled garden, the file formats being the major guardians). For other companies, those formats are a bit of a nightmare, thus they need often to provide the files as editable PDFs.
-
Affinity Designer V2 getting really slow and laggy after some time
SrPx replied to SKT7's topic in V2 Bugs found on Windows
I do that with Inkscape - Designer (but several of those features are now in Designer).- 164 replies
-
- 1
-

-
- affinity designer
- v2
- (and 3 more)
-
Affinity Photo 2.0 Crashing/Closing all the time
SrPx replied to Raphael Bonelli's topic in V2 Bugs found on Windows
Yes, I think those settings are good for the case; I was going to suggest those to be confirmed that are the final ones. 100mp , if I am not mistaken, is about a 11.000 x 9.000 px canvas.Which is something my PC can handle well (in other matters, I don't do photography) but with 32GB RAM (which is the memory you also have, the CPU is quite older, and a laptop version, but hopefully that's not the bottleneck). But painting (what I mostly do) is a relatively low impact operation. I'm sure many filters and photography related operations can put the things to the limit. In the sense that some operations require a ton of processing while others are pretty light. Unless you were doing the exact same operations with same canvas sizes in v1 without lag. Then there'd be a problem. Also, it's a personal theory that I have never been able to confirm, but in other apps setting a too high number of undos, that eats memory (even more, in the past here having the history window open even would introduce slight lag, but that's probably a fixed bug now). Maybe is totally unrelated, but I set it to like 70 as maximum (also as rarely I will need more than even 30, saving different versions is a better workflow for me). Instead of the 1024 undos that come as default. One detail: For me, live filters and other special layers that require heavy processing, or the refining brush, etc, that was typically something that could make the entire app go slow in a large canvas size. When I need speed (ie, for painting), I tend to flatten (rasterize) all what I can and simplify the document. -
Are those 5 seconds (seems tight to be able to do it) enough for you to set "hardware acceleration - open cl" as non checked, off, but actually exit normally the app? As a crash avoids saving any preference setting. People are reporting more crashes and issues with Open CL than with memory allocated (but it can be an issue in very low memory (ie, a 4gb RAM laptop) cases or misconfiguration). Also, showing preferences-> Performance, and preferences-> tools screenshots here could be very helpful. Specially as that's a system (unless you left some detail out) with no card, it's using the integrated CPU graphics. Also, how much RAM has got your system (to compare to what's set on preferences, etc). Windows tells you that in Windows Settings-> System-> About (it even tells you how much memory is really allocated and how much is reserved. Usually not a prob with intel). Another setting interesting to check (again, if fast enough to exit normally so that the setting is saved) is to set the renderer as WARP, instead of your integrated graphics. If it stops then crashing, that fact gives valuable info. If it's crashing, it's not saving the preference, so, another way to avoid the Open CL issues is to directly launch Affinity without Open CL, like recommended here:
-
Affinity Photo 2.0 Crashing/Closing all the time
SrPx replied to Raphael Bonelli's topic in V2 Bugs found on Windows
@Manua Actually, yesterday I myself started to have a minor glitch with Windows Ink. Didn't know it was it, but the glitch was a flashing little square suspiciously similar to certain feedback label that pops when pen & ink features are on. I have that and the service always disabled, as is incredibly annoying while I paint or work on anything graphic (ie, "alt" label appearing on the middle (or the circles appearing everywhere you click, etc) of the screen every time I push alt key. We owe that to our dear MS). So, I suspected that it was triggering those labels for an instant every now and then (I'm constantly picking color while painting). Disabled Windows Ink in both Affinity and Wacom, and instead used "High Precision" in Affinity preferences (as "low" I know produces low quality selections among other things), and then the glitch of the black square disappeared. Turns out it works perfectly with "High Precision", now. In the past, but was several updates ago, I believe I saw an improvement of brush performance switching to Windows Ink, but as there have been several updates since then... And might be just my perception or placebo effect, but did seem to me that High Precision is slightly faster than Windows Ink. Thing is, the 4 things that drastically improved my brush performance, are now reduced to 3 : - Open CL off, the latest software updates to both Affinity 1.x and 2.x apps (they were definitely was slower years ago), and having a 3060 instead of the 1650 graphics card (and 12GB vs 4gb, though maybe that does not affect much) I used before with Affinity. I noticed the difference with each of this, but I assumed Windows Ink was still another positive factor. So, apologies. When you say, 'it makes all super slow' with Open CL off... you are only un-ticking that checkbox, right? You need to leave your Nvidia Quadro P2000 as the renderer, not Warp (but Warp is a good way to eliminate the factor of the graphics card as a problem, to realize if it's other problem. If I understood it well). As it's software rendering only (and really slow). The fact is that not only I did not notice an slow down in my usual stuff to do as a painter, when setting Open CL off, but I even noticed all snappier with it off. When you say, "makes everything super slow", what specifically gets slower ? The brushes, the menus, some filters? Also, for me it is always slow to paint with any live filter on, even if it is applied to another layer. I disable or rasterize those, and paint with very few layers. Still, allows me to paint with four to 10 layers (haven't tested more) in 7000x5000 px canvases (for print and stuff) with Adobe RGB color profile and images in 16bits color mode, brushes of 500 pixels very fluid. All that with Open CL off, very fluid. So, yep, there's some sort of conflict in your system with Affinity (or, some issue in the system itself, that only is detected by Affinity, as it's kindda more picky with a system or driver issue than other apps). I have not tested if I can change the flow with Windows Ink, as I leave the flow fixed value and specific flow response to pressure in all my brushes (indeed, I only change the brush size, and with the Wacom Intuos 4 XL's physical tablet disc/ring, as it's very fast and keeps me in the zone). So, imo just change it to 'High Precision' and sorry for the confusion. They will reach to your case, but it might take a while. But two things: They need to study one case per thread, that's the workflow, so, if you want to have more chances in being seen, I would advice to start a new thread with one small paragraph and your most recent crash report file. The other thing is that they are currently overbooked by fixing bugs and working at full throttle on the Affinity apps (and as you know, small staff, they can only attend stuff as they can humanly can). But yep, imo, make a new thread with the crash report file attached. And sorry about the confusion about Windows Ink, but I was wrong about my own setups, actually, you can and maybe should set up "high precision" instead. Also, sharing your Preferences/Performance, and Preferences/tools , Preference/Interface, Preference/general screenshots could be helpful for them to see if there's sth off or anything. -
Can't Export PDF to RGB (only has CMYK option) in AD
SrPx replied to spiritsoul's topic in V2 Bugs found on Windows
With PDF/X-4 (in Photo 2.0.3, but I guess is the same in Publisher) it also can't be set RGB, and if left blank exports as CMYK. Yep, at least this one definitely should allow setting RGB color space, and a color profile (ie, Adobe RGB). Amazon -important with the boom of book publishing- requires PDF for the KDP hard cover, but I never was able to find if it needs PDF/X or regular PDFs (for the ebook digital covers I believe it is yet Adobe RGB color profile and TIFF). Still, PDF/X often avoids issues in the printing job. PDF/X-4 using RGB (and letting the RIP deal with it) is even a requirement for a good number of places now, for whatever. I myself got used through so many years to just have to export PDF/X-1a (which since always meant a CMYK file or spot colors), but I started to be surprised years ago when certain print companies, even "big" ones, started requiring PDF/X-4 and in RGB, Adobe RGB profile. -
Affinity Photo 2.0 Crashing/Closing all the time
SrPx replied to Raphael Bonelli's topic in V2 Bugs found on Windows
Which settings do you have in Preferences/performance and preferences/tools, @Manua ? I had some app lag, and some serious issues with brush lag until I disabled Open CL, (but left my nvidia card, not warp) but also set Windows INK in input method in preferences/tools but as well at my Wacom's panel (through windows control panel), in the app's profile for Photo (or etc), -btw, how to do that, here - in the "projection" tab. Also, I had issues with .net (repaired), SFC and DISM found some corrupted system files (fixed by them), and did not get totally smooth brush work until used a tool to uninstall my nvidia drivers, and installed the most recent Studio ones. Left GeForce Experience to auto update the drivers, but being nvidia Studio drivers, that is not frequent, thankfully. Currently my brushes go as fast as in clip studio. Some eventual freeze (but it recovers after some seconds, no app swap needed) occur when I am editing the brushes settings, specifically in the brush's pressure curve setting, while handling those nodes, usually when I "fail", and click outside the actual node, in the dynamics tab of the brush configuration (that window which you get when double clicking on any brush on the list; the changes there get saved for ever in the brush, unlike when you change them in the toolbar) . But knowing that, I change the pressure curves with my mouse. It does not happen anywhere else in any affinity app any more. So, kind of all what I applied (above) works outstandingly for painting fluidly. I've told these settings and actions to some other people with brush/app lag and it has solved it. But who knows. Edit: Besides the needed (for fluid painting) open cl off and activating both windows ink in wacom panel and affinity, I'd really use certain tool to fully uninstall your nvidia drivers, and be sure to download the latest graphic driver for your specific Quadro graphic card. I'd restart the system before installing the new drivers. Nvidia drivers full uninstall tool : https://www.guru3d.com/files-details/display-driver-uninstaller-download.html Edit: Important, @Manua If my memory does not fail me, you do need to choose Studio drivers (also, supposedly more stable) with a quadro card, now that you are going to download them. The laptop vendor might have installed the game ready ones. I use the studio drivers with a 3060, both in a laptop and a desktop, it all goes pretty well for painting. The brushes surely won't go fully fluid until the open cl is off and the windows ink is set in wacom panel and affinity prefs, but I've seen the dump, and strongly suspect the driver (uninstalling with that tool) re-install is needed. -
If it crashes in seconds and have never been able to exit normally, then the no-open cl setting is not saved; preferences seem to need a successful exit to be saved. There is a way to launch Affinity apps without open cl, for these cases (among others) :
-
Ouch... SORRY. I really need to sleep more. I have just realized I understood badly the issue, since the beginning.. It'd be bad to delete all my posts now, for the thread's coherence. You mentioned "pixelated", and not smooth enough, while for some strange process in my brain (prolly too fast reading and being sleep deprived) I was thinking of blurriness, the opposite. If things get too pixelated, my general rule is to export at very large pixel size from the vector app, and then resize on the raster app I think provides me with best pixel output. This typically provides me with best line and font quality for a client sample (the rare cases when I don't just use PDFs for that) That is, I often leave this to batch processing (often with lanczos) in irfanview, XnView, or even just Photo, as from a big image and treating it with raster filters, you have lot of control. But yep, apologies as I had not understood well the matter, thinking of "poor quality" as blurriness. I mean, I initially read pixelated and that, but seems my brain went to other posts that previously appeared here. Some of what I say (as tricks, never solutions) still applies, but using other filter, not unsharp mask.
-
Yep, while Windows Paint surely is showing a PNG (of course, never a JPG to evaluate sharpness, due to the compression. But I guess that's implied) without many tricks -and yet I'd only trust a view in 100% zoom, in any viewer... and even so, who knows, after all I have been able to realize in many apps, including Adobe's- I would warn people about browsers, though. In some cases they do "smart scaling", ie, whenever not showing an image 1:1 (100% zoom) because the web code is making it to show smaller or bigger. I tested back in the day (maybe browsers have improved now, but anything happening in real time tends to be lower quality, by nature) that those resamples are in lower quality than even bicubic and certainly lanczos 3 resample (and of course, that many browsers don't have color management, or not "ON" by default, but that's another issue, tho can affect contrast perception, and so, sharpness perception, which can be happening also here with different conversions in different apps from CMYK to the PNG's "forced" RGB). And I would not be surprised if in some browsers (there are many: Safari, Opera, Chrome, Firefox, Edge, etc) there's some resampling by default even if the web page code isn't telling it to show at a different size. Responsive design anyway (which is everything, today), is re-scaling everything constantly, and the browser, to my knowledge, never gets lanczos 3 resample quality. Anyway, I would go to the process I mentioned/listed earlier, as I myself believed what was being said here by two or three people in the forums (which could be true for some use cases if not knowing the following) about the image exports from Affinity (all apps, as the export engine I believe it to be the same), and proved (to me) the final situation not to be true (IF knowing what to do), when just setting Lanczos 3 "non-separated" -which in Affinity includes strong sharpen in the process- the export was super sharp... indeed, a bit too much. So I realized the best is Lanczos 3 "Separated". As while it outputs things a bit too smooth, it has enough detail and information to gain sharpness without losing info: While the smoothing happens later, I tested that if you add an unsharp mask filter previous to export (or live filter over everything, affecting all layers), the result is pretty good. btw, I am a professional graphic designer (decades, sigh), 3D artist and illustrator (many years, had to switch fields often). Well, I am also a hobbyist, too . I only say it so that the solution is taken in consideration, as going that path should end up with good exports. If one is trying to export a PNG direct from vector content... for this trick (and if willing to get a super sharp sample) it's needed to flatten/rasterize all first (and undo later, not saving the source file flat, obviously) , something I used to do in Adobe's apps, anyway. From Designer, best is to click "Edit in Photo" in File menu, apply in Photo an 'unsharp mask' filter, then export as PNG. Edit : But if for some reason (I wouldn't understand that in a professional environment) you did not get the 3 apps, so, can't click "Edit in Photo" for the Unsharp Mask (and other sharpening filters), only have Designer, then you might want to go with lanczos 3 non-separated, if really want a lot of crispness. PD: Might be my 50 years old eyes, but, exporting direct from Designer 2.0.3, a design with text exported as PNG Bilinear (even bicubic) seems as good as lanczos 3 non-separated. And in any case -as another professional- I am not seeing anything bad in any of the exports (but I am trying to). Definitely even the most strict client would not complain. Besides most of the times the clients know little about technical matters, deeper matters in composition, color, the concept itself would be more of my priority.