
McD
-
Posts
27 -
Joined
-
Last visited
-
We'll keep searching but there's no ideal suite. PugetBench tries but I wonder how hard given they're a PC vendor. M-series performance must really stick in their throats as their benchmarks kind of countered their marketing.
-
 McD reacted to a post in a topic:
Benchmark results v20000
McD reacted to a post in a topic:
Benchmark results v20000
-
I'd love to but sadly SYSmark isn't cross platform (odd given it mostly leverages other packages) so of little use. CrossMark is Apple Silicon native but it's woefully sub-optimal as my processor usage graphs show. So that's a no-go as well.
-
If you'd have quoted Anandtech from 5-years ago, I'd be with you but since Anand & Andrei have left I don't even both with it. The problem you have is that while the white paper cites popular applications, I'm pretty certain it doesn't use their code so citing those products is misleading. My own processor usage info tells me there is no optimisation whatsoever for Apple Silicon (perhaps you can produce similar processor utilisation data for other platforms to compare) so despite the plausibility of the benchmark, the really isn't there - how can it indicate the performance of a system it's literally not using? That said, for same-platform comparisons (Windows PC vs Windows PC) if the software has been optimised, it's probably useful. Your point on trusting the optimisation of mainstream applications is absolutely correct because that's what benchmarks really show - commitment to software optimisation for a given platform, not that platform's hardware capability.
-
I think we're in agreement about the myopic nature of synthetic benchmarks. My issue with them is the massive emphasis they put on, often irrelevant, specific components to represent a much broader workflow but that's the mistake of the user not the benchmark. The Affinity Suite, for example, would never write so much data for the SSD speeds above to be significant, also those speeds are, likely, for large sequential writes so irrelevant for memory swap files and the majority of drive transactions. In fact, even video exports may not benefit from faster SSDs because even minor processing & definitely transcoding present the bottleneck. So when we broaden the scope of the benchmarks we have to attach appropriate significance to the results or we construct a false representation.
-
If benchmarks are spilling to SSD the results will tank compare to RAM-resident results irrespective of your SSD speed & if you're buying entry-level Mac hardware, speed is probably not your main concern. Apple SSD controllers are pretty good especially if you have drive encryption enabled. You could make the same argument about discrete component architecture of PC workstations - as the Affinity combined score highlights. It shows the performance of a workload running across multiple logic areas (CPU/GPU/ANE) w=as they should do using the best hardware for that part of the task - this is where Apple Silicon shines and outperforms PCs easily. You mentioned Application-based benchmarks, I'm a huge fan of these - usually macros controlling real applications like Pugetbench. The BAPCO benchmarks aren't this, they are pseudo workflows not using any commercial engines i.e. "spreadsheet" but not Excel, Image editing but not Lightroom, video editing but not Resolve so it's hard to take these seriously as they seem to be suboptimal (see occupancy graphs) so I don't think they should be used.
-
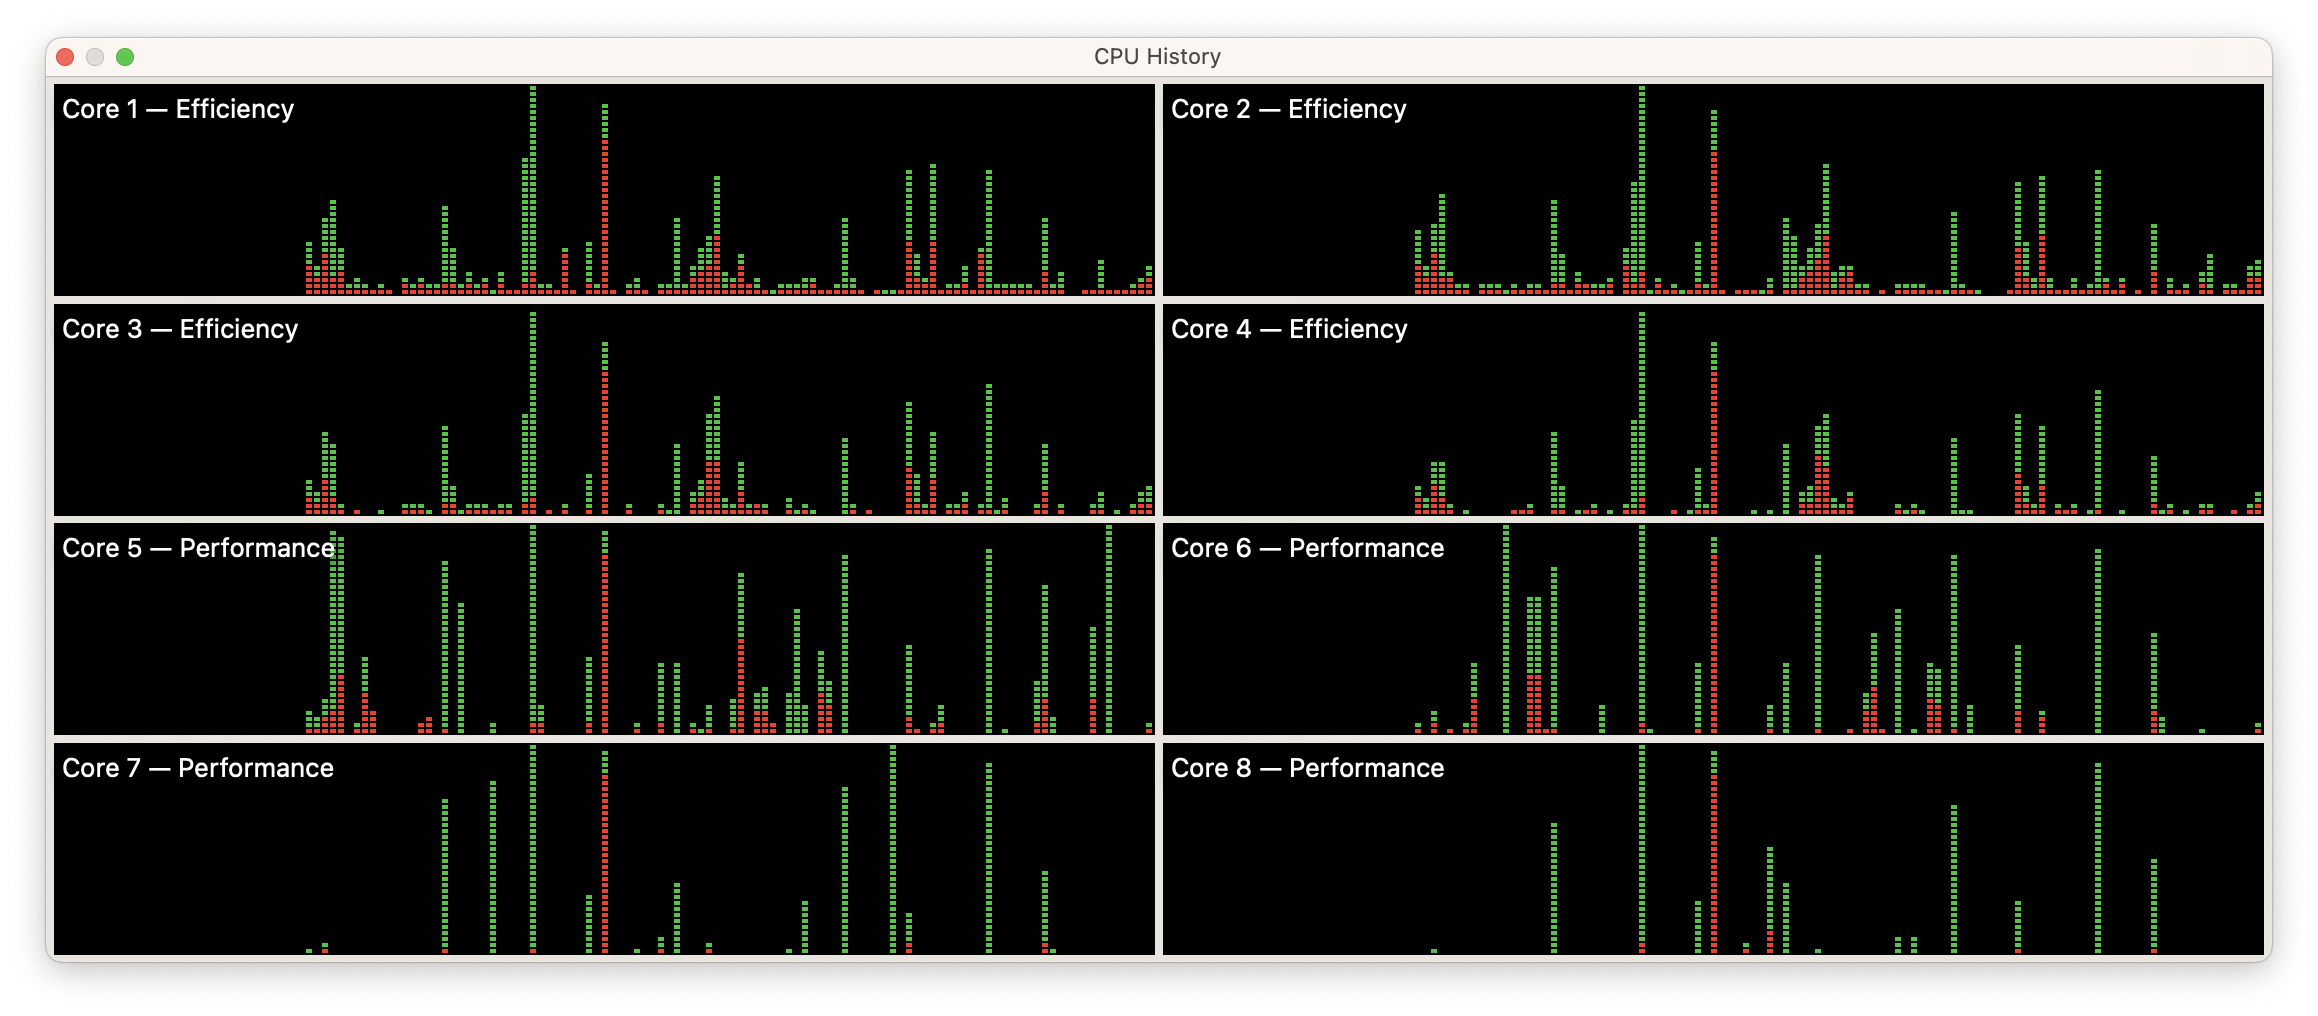
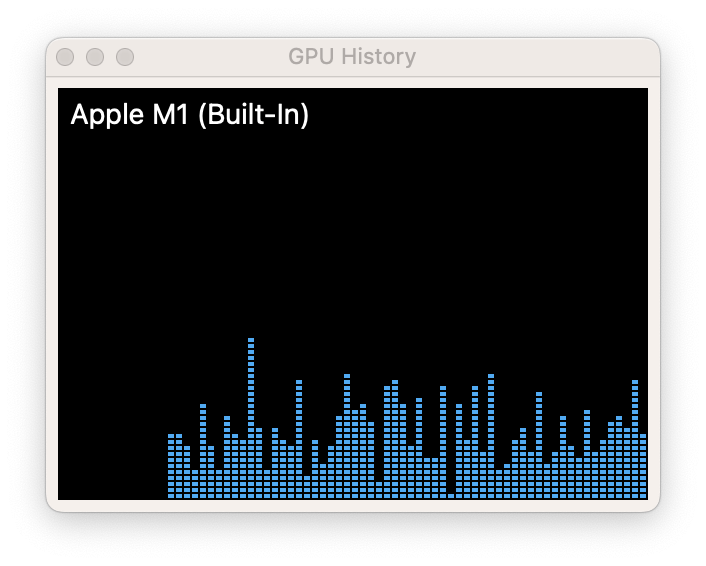
Hmm - when I saw Intel K-series in the notebook charts & the Core I7-8550U near the top I questioned the whole benchmarking suite. The good news is, it's native. The bad news is - see images (they span the full run). There can be no confidence in this benchmark's ability to measure the hardware capability with almost no tasks stressing the CPU or GPU to any reasonable degree. Even "video editing" failed to push the GPU above 20%. My suspicion is this is a WORA runtime running fictitious workloads which speak to the runtime environment efficiency more that HW capability. I really don't know what it was meant to be doing.

-
As far as I'm aware Cinebench R15 was never converted to Apple Silicon (only R23) so how can it be considered a valid benchmark? Also, these results depend on the benchmark used and speak more of the vendor's optimisation effort than the hardware capability we're looking to compare. So whilst 3D Mark may show parity with a GTX 1060 (there was no Titanium edition), GFXBench (which is optimised for Nvidia, AMD & Apple) shows Apple's mobile M1 Pro at parity with a desktop GTX1070 or RTX3050. Of course it may be more fair to compare the M1 Pro with Nvidia mobile parts in which case it compares to a 3050Ti in 3D Mark and between a 2060-2070 Max-Q in GFXbench. More mid-range than low end as it is Apple's mid-range processor. Of course the M1 Pro has just been replaced with the M2 Pro which is considerably more graphically performant so I'm not sure what we're trying to prove with this thread. If we're saying real world product performance is more about software optimisation than hardware capability - I agree, so pick your benchmarks & your apps carefully.
-
This may be the case with the current benchmark but for 11021 we definitely saw AMD acceleration, the 6900 was near the top of the pile. Please note combined scores are better on Apple Silicon because that's an inherent benefit of Unified Memory Architecture (uses the right logic block for the task with no round tripping)...
-
And Tom's hardware is a PC fanboy site with literally nothing good to say about Apple despite the figures. Look at how the M2 article focusses purely on hypothetical performance by compute (TFLOPs) when 2D & 3D rasterisation requires so much more. The M1 Ultra (64) outperforms the RTX3090 in rasterisation by ~10% with only half the compute (20 vs 40 TFLOPs). Ad hominem zealotry aside, Cinebench is not a GPU benchmark and 3D Mark GPU benchmark you suggested doesn't back your argument. 3D Mark Wild Life Extreme on M1 Pro: 10352 3D Mark Wild Life Extreme on GTX1060: 8583 average If there's another optimal benchmark we should be looking at by all means suggest it.
-
Cinebench is a CPU test, nothing to do with your GTX960. On 3D Mark (Wildlife), here’s an M1 Max beating out a 3080ti
-
It’s a shame there isn’t better hardware identification built into these products generally (not just for benchmarks). I would have thought this would assist with fault reporting too.
-
McD reacted to a post in a topic:
Photo Benchmark 11021 Results
-
Photo Benchmark 11021 Results
McD replied to MikeTO's topic in [ARCHIVE] Photo beta on Windows threads
Yeah & the ‘combined’ scores are up there with the MacBook Air. -
McD reacted to a post in a topic:
Photo Benchmark 11021 Results
-
MikeTO reacted to a post in a topic:
Photo Benchmark 11021 Results
-
Photo Benchmark 11021 Results
McD replied to MikeTO's topic in [ARCHIVE] Photo beta on Windows threads
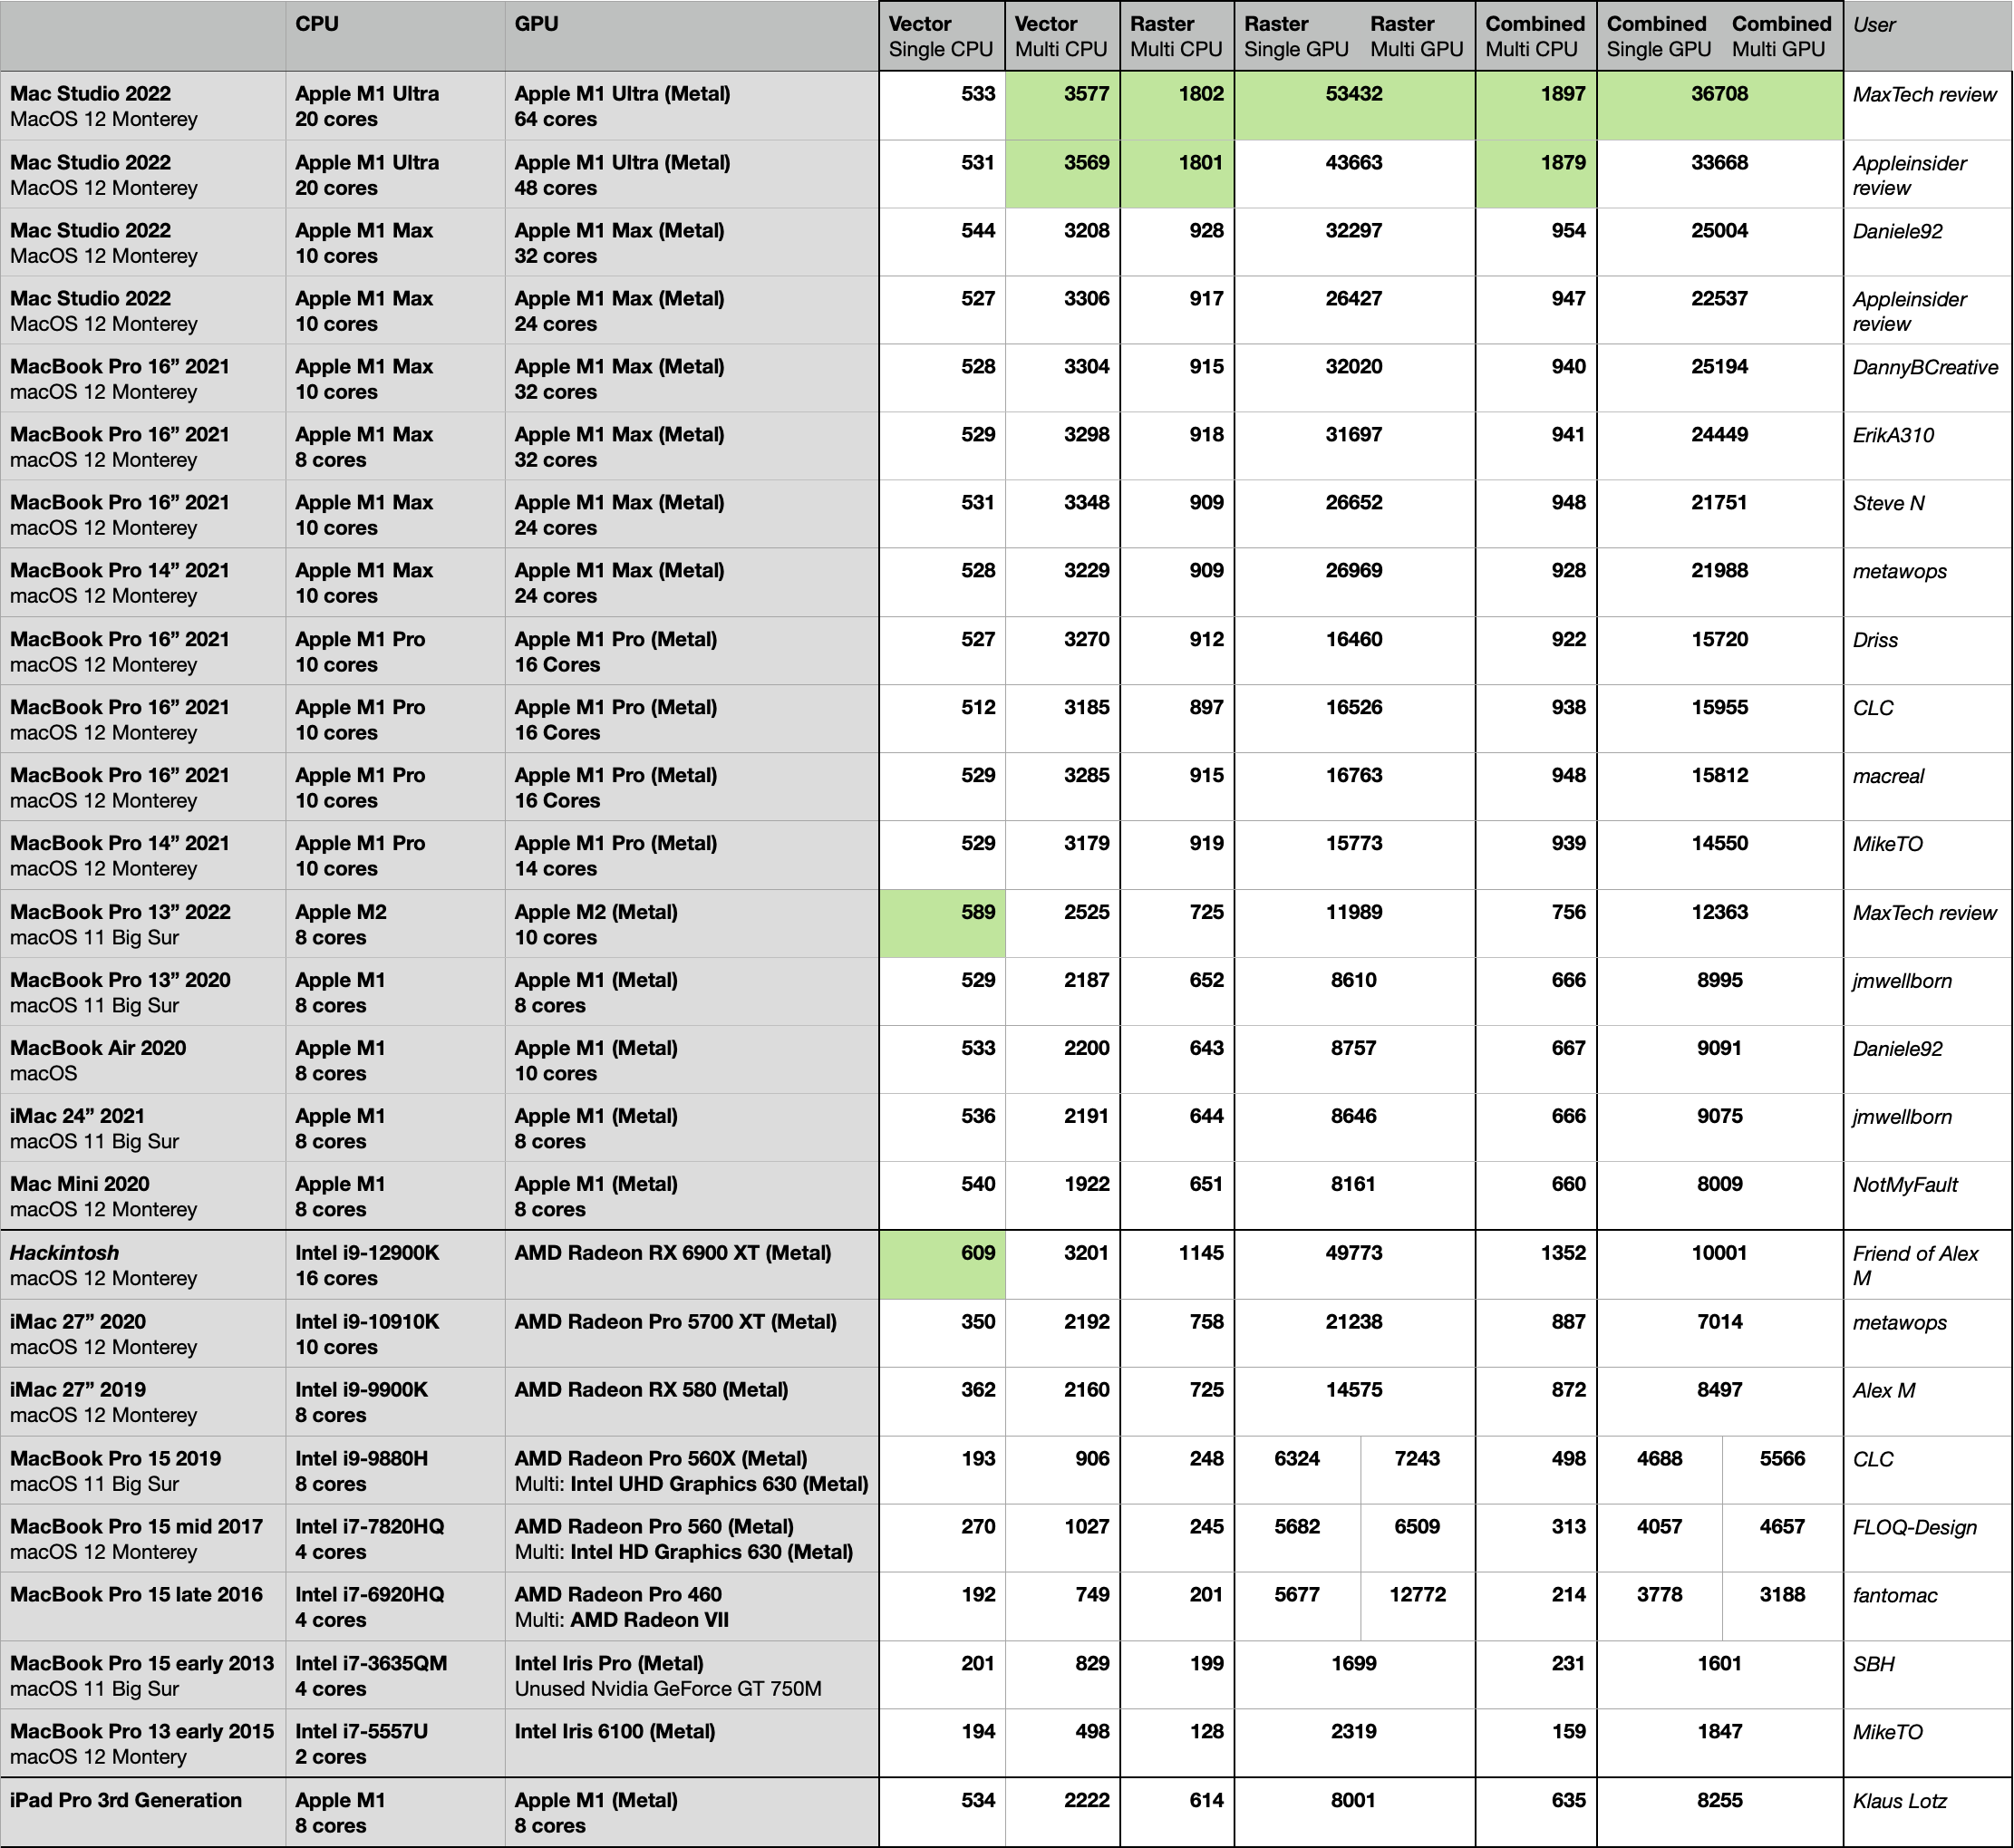
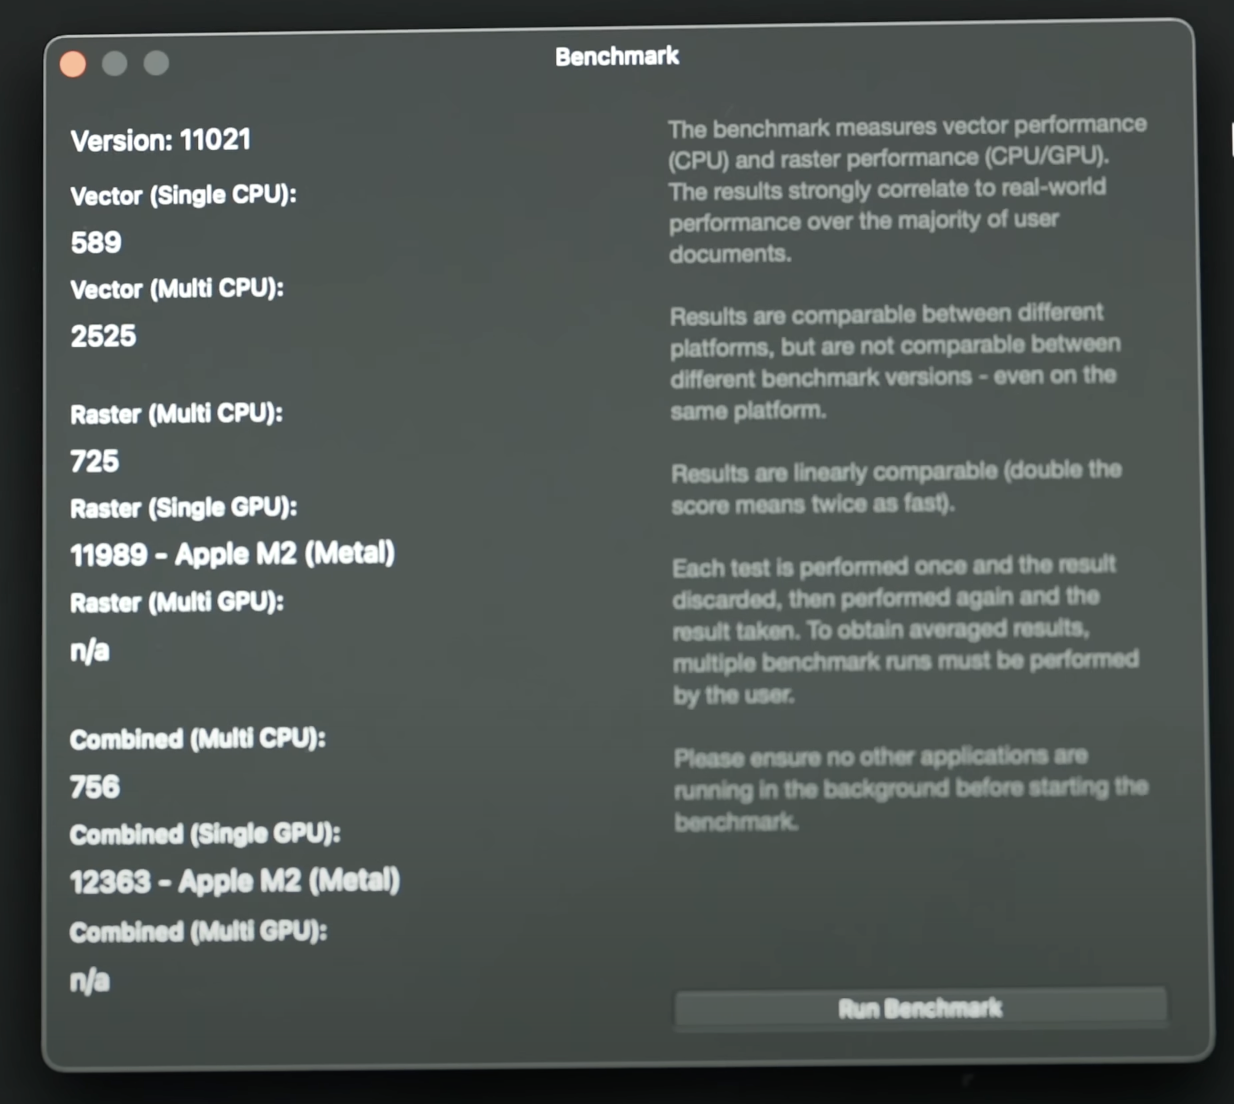
And from another MaxTech review for the 10-core M2 MBP. Nice single core CPU but not quite the 12900K - I wonder if it uses 2xNEON or just 128-bit. Odd that the combined score is higher than the Raster score, I don't think I've seen that before.
-
Affinity Photo
McD replied to EkimEnaid's topic in Pre-V2 Archive of Desktop Questions (macOS and Windows)
Yeah, I saw something corroborating this on cpu-benchmark.org (an M1 @ 650GFLOPS) but I'm unsure of it's accuracy/source there's a lot of plagiarism on the web. I also looked up the Radeon VII scores and they're quite disappointing so I guess FP64 is just a factor assuming all else is in place but thanks for the sleuthing, always fun. -
Pandovski reacted to a post in a topic:
Affinity Photo
-
Affinity Photo
McD replied to EkimEnaid's topic in Pre-V2 Archive of Desktop Questions (macOS and Windows)
Actually the RTX3060-3090 are 0.2-0.5TFLOPS FP64 which is quite close in comparison to the 6900XT at 3x that but they are closer to the 5700XT in FP64 compute & the table concurs. Two things; 1) I can’t find any valid data on M1 Max/Ultra FP64 compute (only FP32 @ 20.8TFLOPS). Any ideas? 2) I’d love to see Radeon VII figures for the benchmark. That thing has 3.3TFLOPS FP64 & could break 100K. Side note: of course all this is just a distraction. The real magic is in the combined scores which is a confusing benchmark because it looks like a vector+raster workload. However, as vector only runs on the CPU it’s actually CPU+GPU workload & shows off what UMA can give.