
Rowjam
-
Posts
7 -
Joined
-
Last visited
-
I think you’re right. She’s definitely not using a calibrated display. We’re going to try and get a hex reference for the colour she is seeing during zoom using a colour picker on a screenshot and then go from there.
-
I’m showing a client designs for a logo by screen sharing using zoom but when I send her mockups she is seeing a different colour from what she sees in zoom. I’ve tried viewing pdfs, jpgs and png files on various screens in different software and I’m seeing the same colour with slight variations as you would expect. When I show her the pdfs on my iPad using zoom she sees the same colour as when I show her Affinity on my iPad. She really wants the colour she sees on zoom. I’m using a Pantone and have all the details for that Pantone. I realise this isn’t really an affinity issue but this is the first logo I’ve designed using Affinity for iPad so I don’t know how close the Pantones match to print. Does anyone have any suggestions on how to see what the client is seeing and give them a closer colour match?
-
Can I automatically create a jagged edge
Rowjam replied to Rowjam's topic in Pre-V2 Archive of iPad Questions
No worries Dan. Thanks for taking the time to reply. Happy holidays. -
Font Issues Working between Desktop and iPad
Rowjam replied to Mike W077's topic in Pre-V2 Archive of iPad Questions
I’m trying to import ttf fonts into Designer for ipad. I import them using the preferences screen but when I go into my artwork to edit it the fonts aren’t on the font list for the text tool. Can I fix this? I love this app but the built in font list is very limited.
-
 DM1 reacted to a post in a topic:
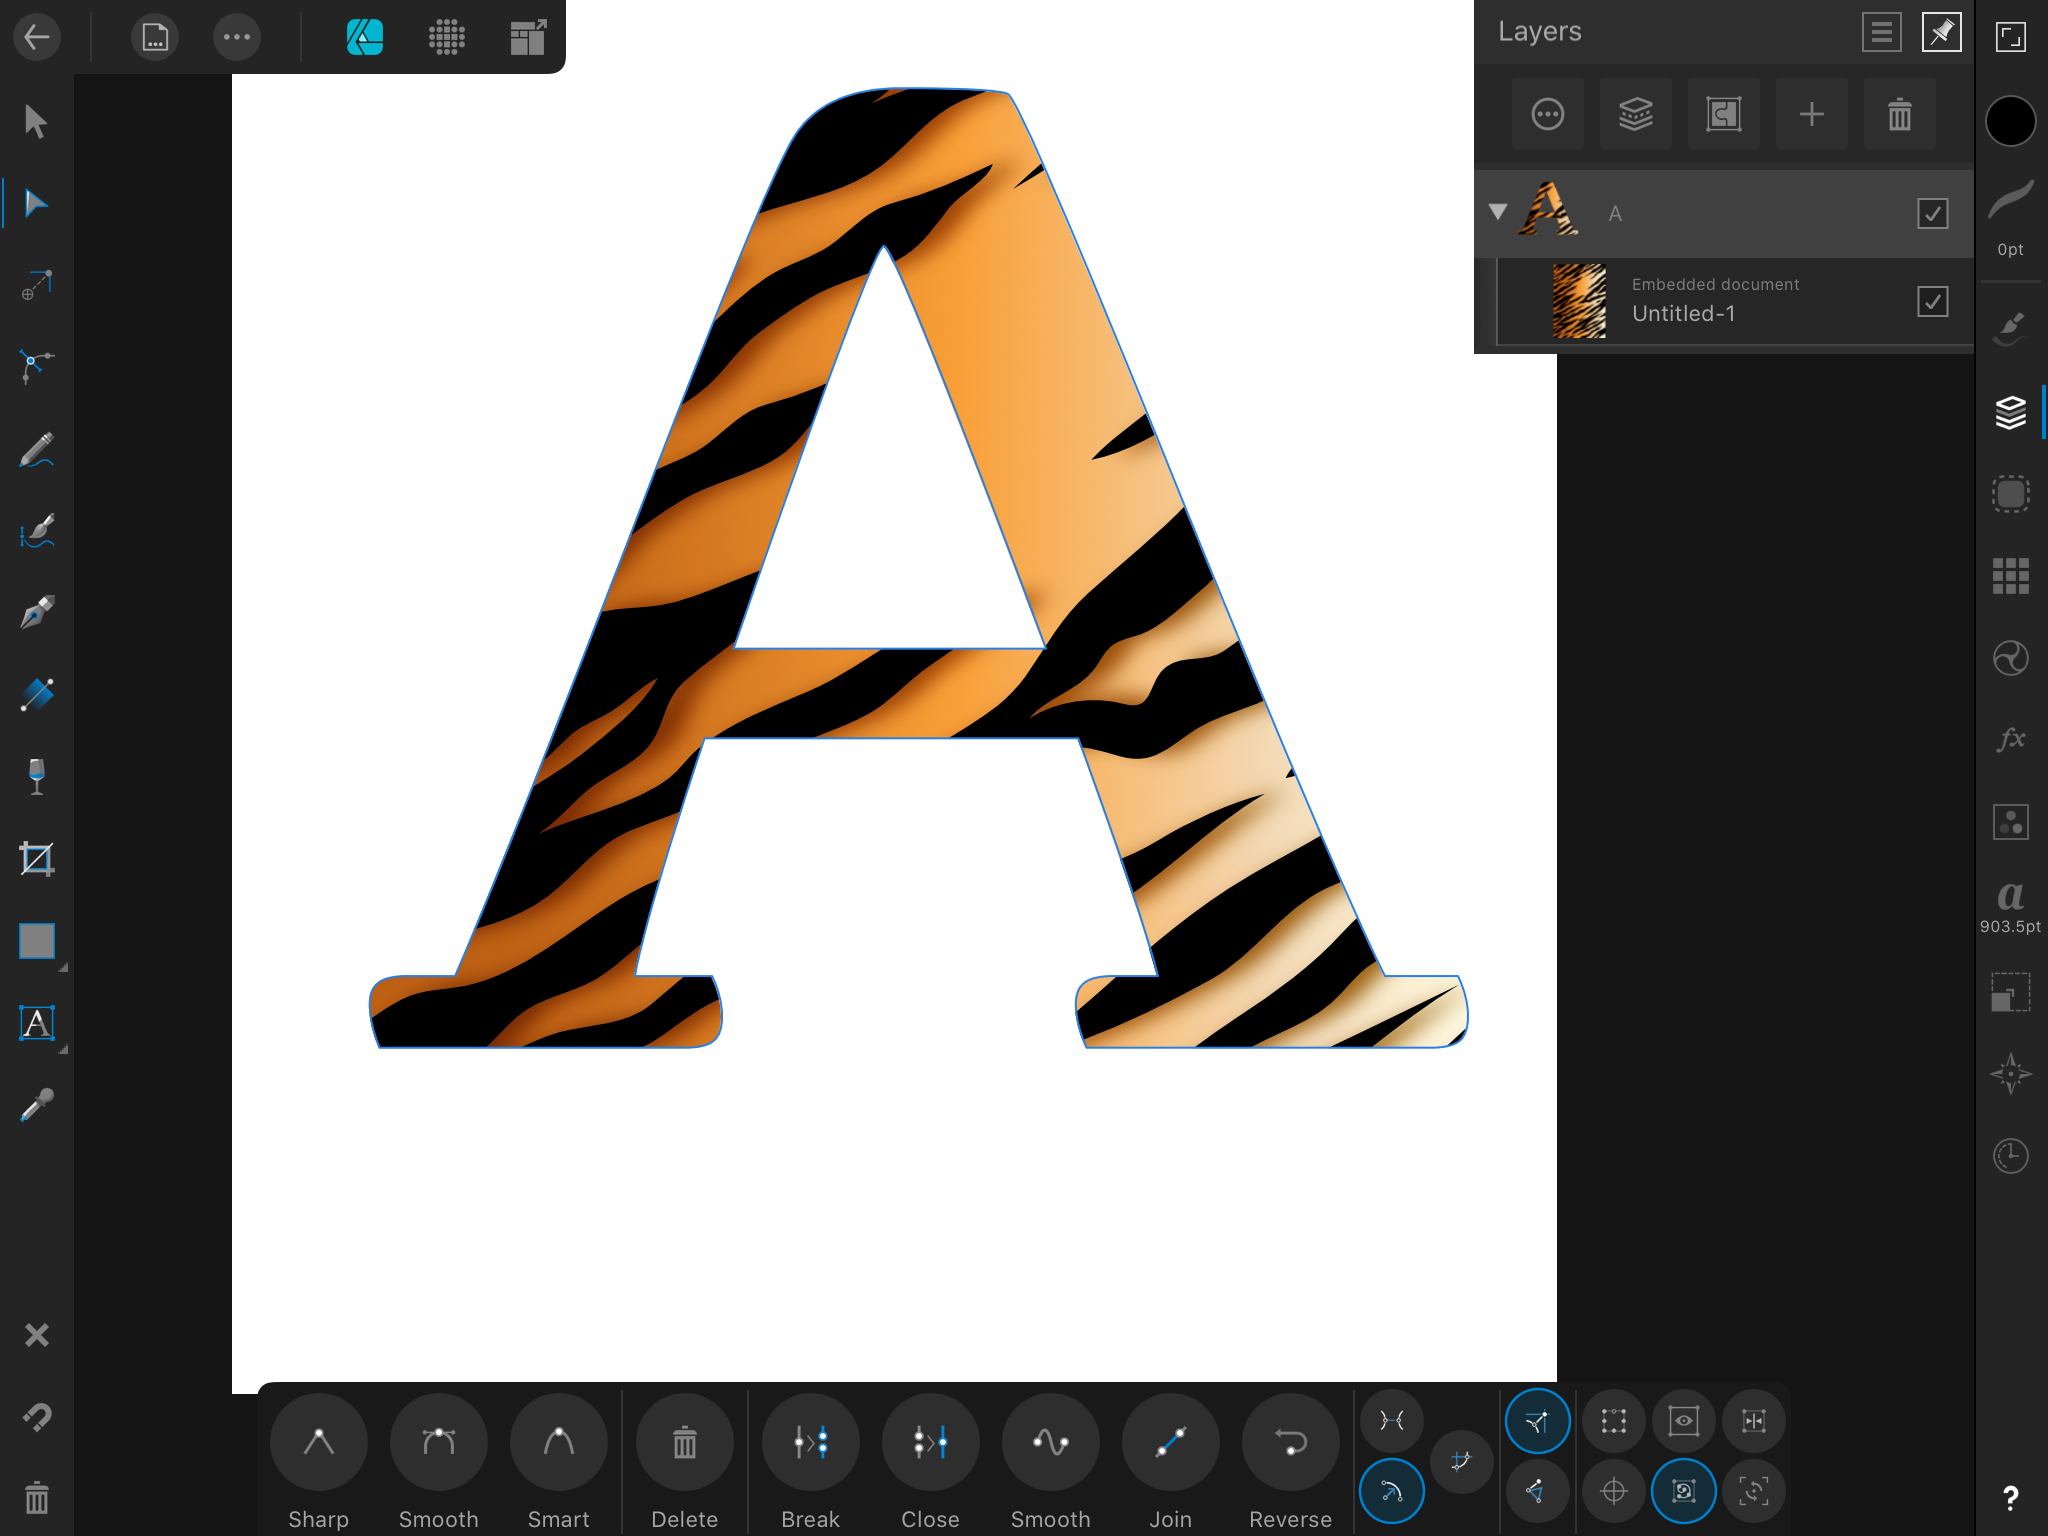
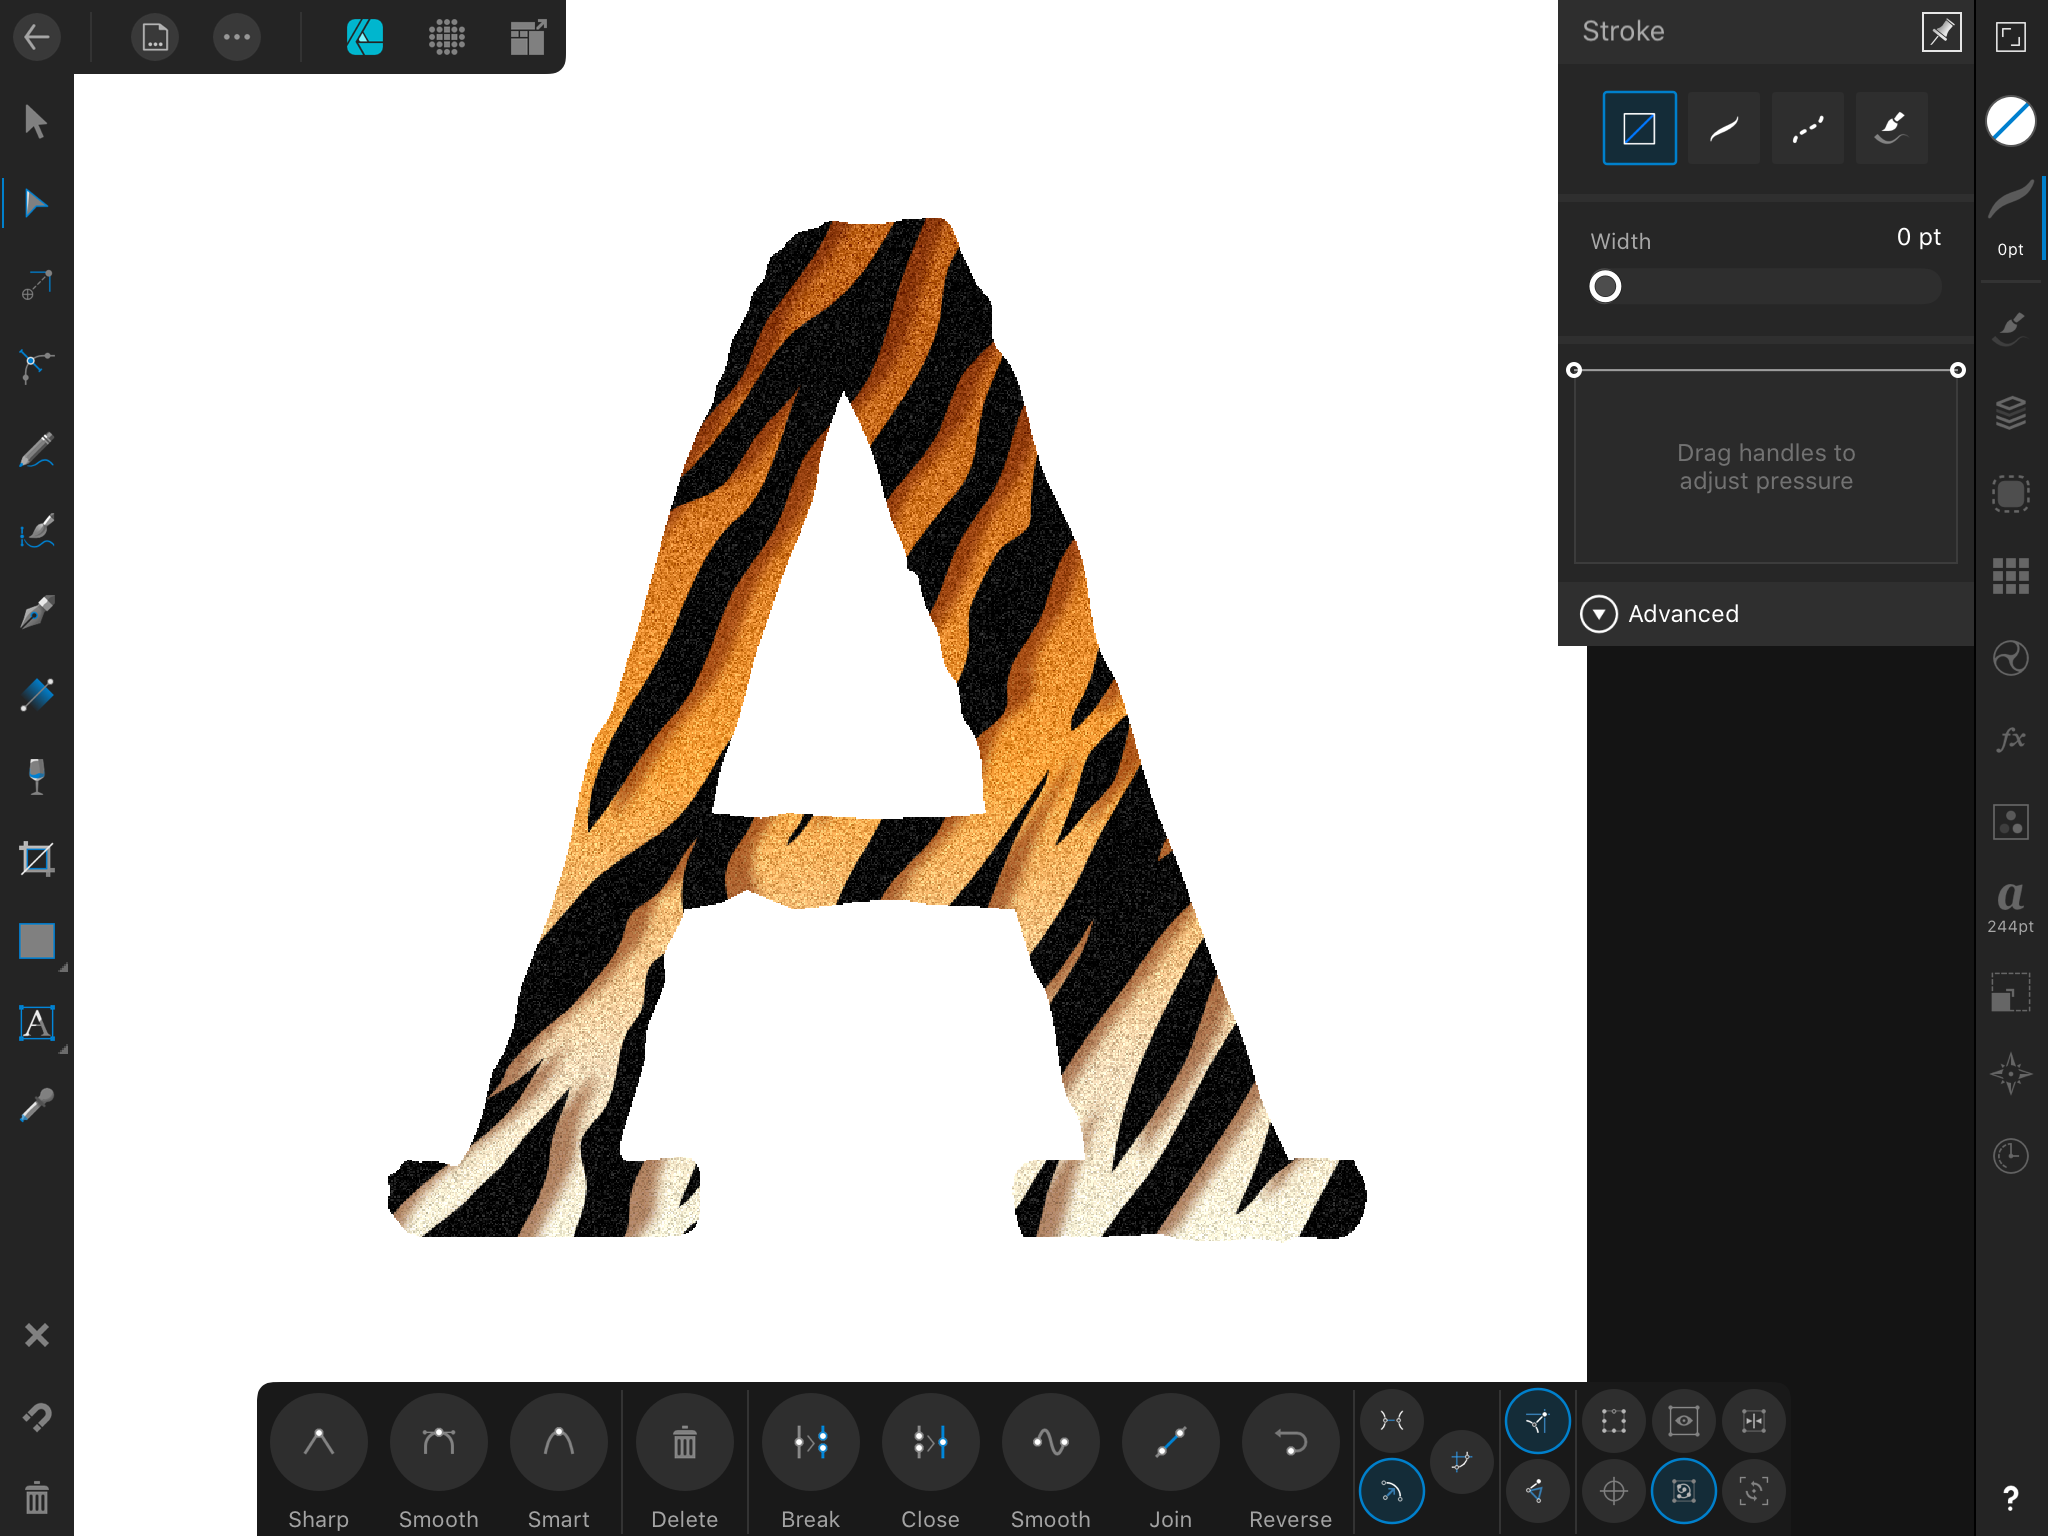
How can I convert Art text to editable nodes with losing the fill
DM1 reacted to a post in a topic:
How can I convert Art text to editable nodes with losing the fill
-
Is there a way to add multiple nodes to create more complex jagged edges on a shape automatically. I’ve attached a picture to show what I mean. I used to use some macromedia software years ago and you could automatically make lines and shapes more complex, rough/jagged. Sort of the opposite of the smooth tool in Nodes.
-
Doh. Sorry! Literally just figured this out. Convert to paths then embed graphic!
-
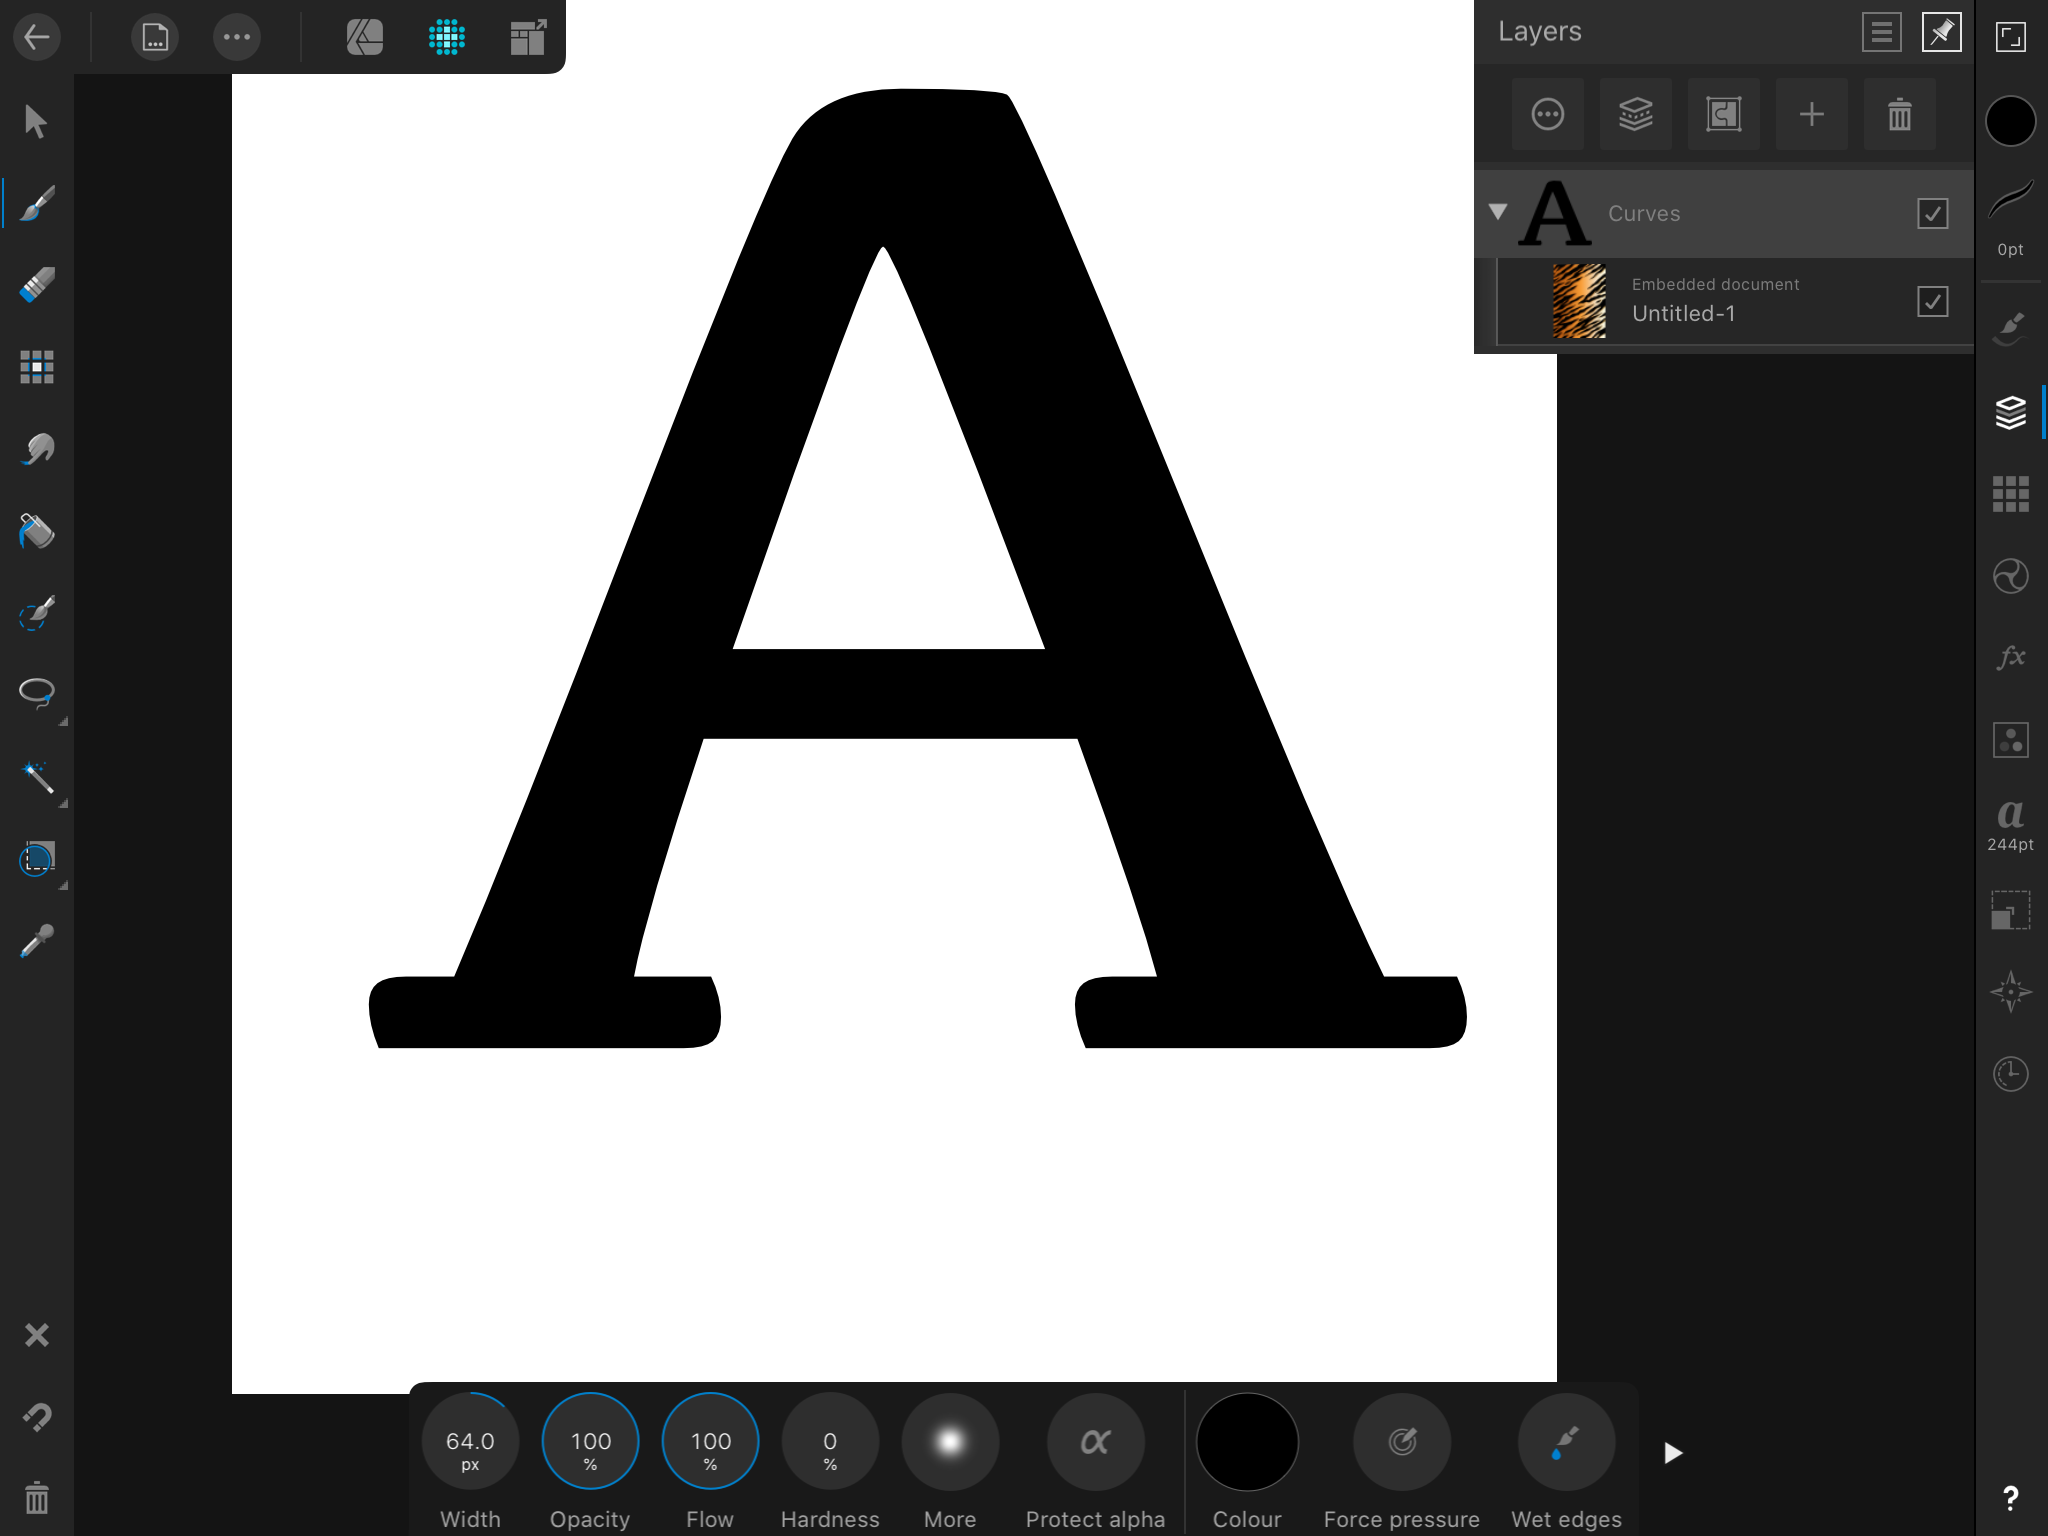
Hi guys. Bit of noob here. I created some Art text which contains an embedded vector graphic as a fill. When I convert to curves my embedded graphic turns black. How do I convert the text into an editable curve that I can manipulate without losing the embedded graphic? Apologies if I’m not using the correct terminology. I’ve attached a before and after shot.