Search the Community
Showing results for tags 'ram'.
Found 16 results
-
 Hi, hope everyone is doing well. I have a question regarding what kind of performance would I get with the Affinity 2.0 apps if I purchased an M2 iPad Pro with the maxed out 16GB RAM. Are the Affinity 2.0 apps optimized to utilize the full power of M2 and the max 16GB RAM? And please, it would be lovely if I can get the RAM size or portion that each Designer, Photo, and Puplisher occupy when started with 1 empty layer or blank canvas.
 -
 If I have only 8GB RAM and I am working on a large, image-heavy file, how should I set "RAM usage limit" to give me the best performance? At 8GB? At something lower? Or would this setting make any difference to performance?
 -
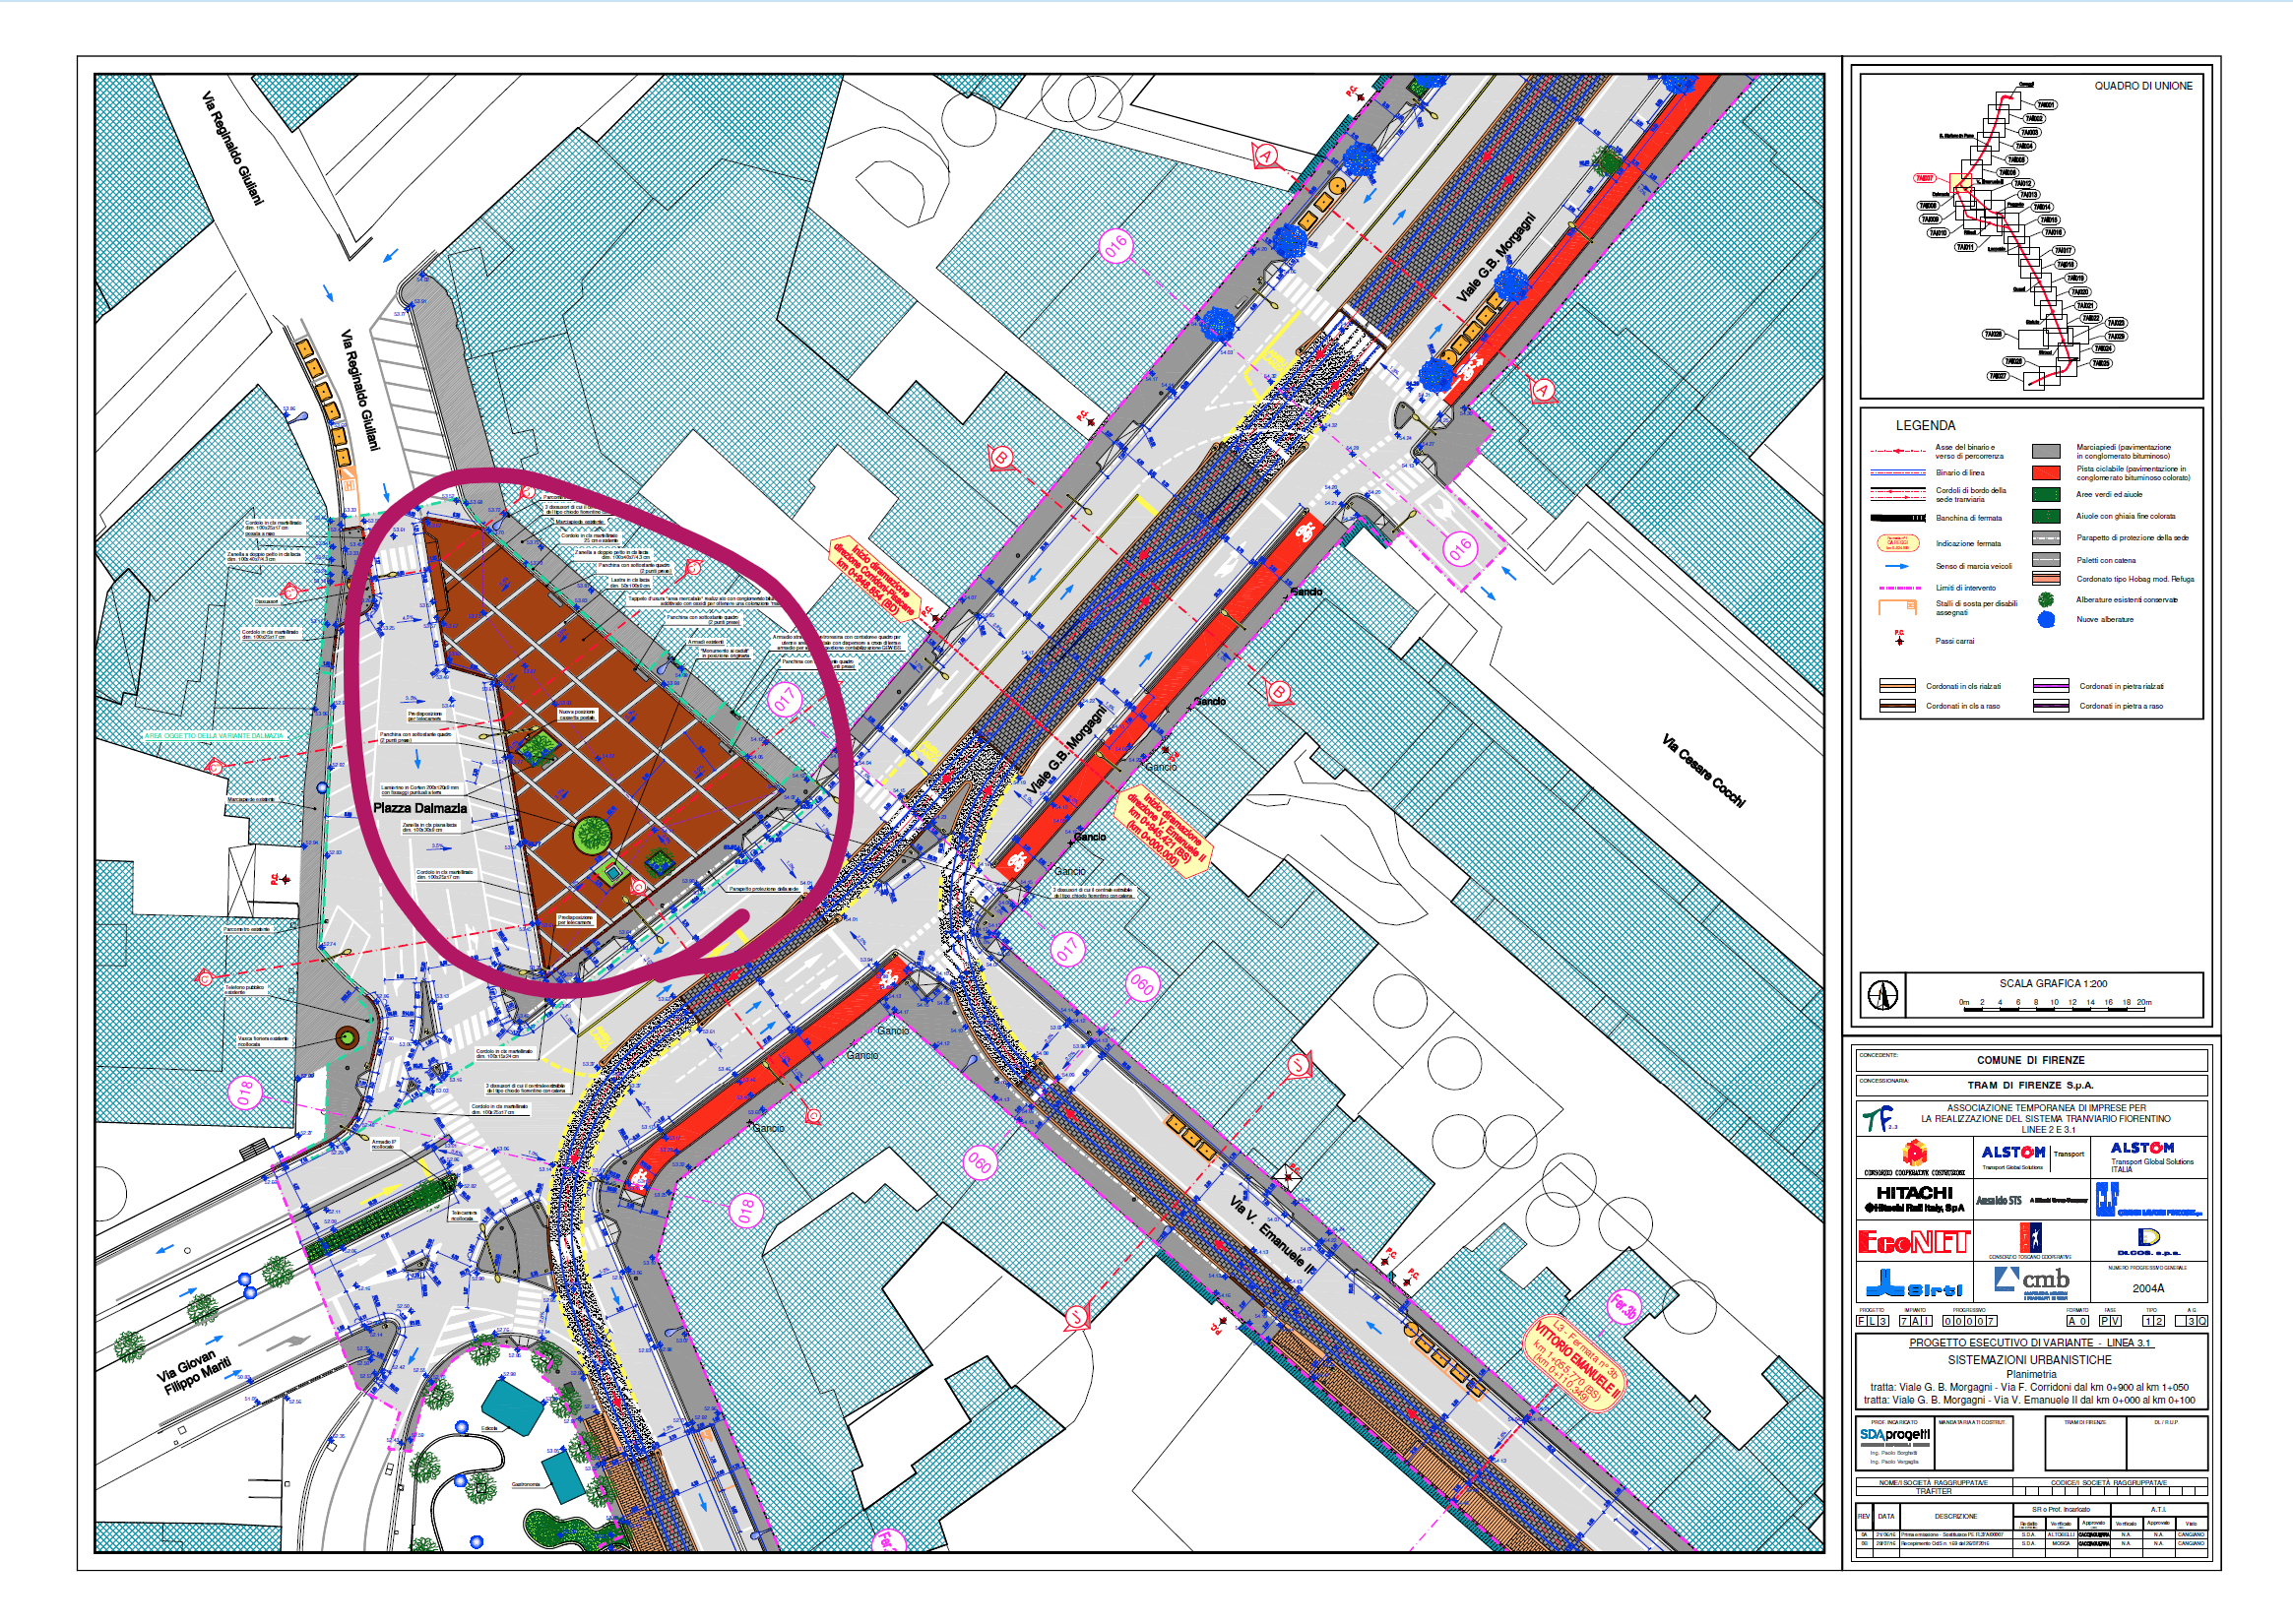
 Hello, I just opened this publicly available PDF file which is ~10 MB in size, yet consumes over 24 GB of memory at times. Illustrator couldn't handle removing the brown hatch, whereas Affinity Designer could. 😃 However, Illustrator only consumes slightly over 5 GB of ram upon opening for the same file, which dropped to 4 GB once Illustrator was recognised as process within the Task manager (Windows 10). Whereas Affinity had been over 20 GB while loading the file and over 24GB when actually working in the file (after having removed the brown hatch and having rotated the file by 90 degrees. Values are CPU % | RAM usage | Disk write speed, it was at 96% so Designer had to use my SSD. I would expect this to be a good file for the team to look at to see whether there are additional performance gains to be had from CAD exports. I really have to praise the development team's efforts, because once open, the navigation is still buttery smooth compared to slow dinosaur that is Illustrator! I was septic at first seeing the 1.9 release video, but now I am impressed. 👍 I do hope this RAM issue could be sorted out. 06_3-5-6-2_PropVar_L3_2004A_P03.pdf
-
 I'm trying to creating an infinitely zooming picture that zooms in on the mean mugging baby's eye. I plan to write some code that zoom's in on the baby's eye, and once the zoom get's to a certain point, I will place the original picture overtop of the picture in the eye. To do this I have to make sure the original picture, and the picture in the eye have the same background, so I'm creating a rectangle with the right proportions around the baby, and then trying to scale it down until I can select it and copy the content that would be around the baby inside the eye, but when I scale down that low, the proportions can't scale down accurately enough because they must scale at even numbers for pixels (no decimals), when I scale back up, the rectangle doesn't fit properly. The video attached shows what I'm trying to do. ------------------------------------------------------------------ When I try to increase the size of the image past 45000 pixels, my computer freezes up. Is there anything I can adjust to fix this? These are the details of my computer Affinity Photo v. 1.9.3 Mac Mini 2018 Mac OS Big Sur v. 11.4 Processor: 3.6 GHz Quad-Core Intel Core i3 Memory: 20 GB 2667 MHz DDR4 mean-muggin-baby.mp4
 -
 AP 1.9.3 Working with a single 12k x 12k pixel image loaded from file after a fresh start. Worked on it for about 10 minutes, mostly using the fill tool. Closed the image without saving. Checked the memory in Activity Viewer. Real Memory Size: 4.8GB, Virtual Memory Size: 18.9GM, Shared Memory: 130MB, Private Memory: 5.34GB. This type of massive memory leak happens all the time, I frequently have to save and restart. Fills to significant parts of a large image often freeze the entire UI; when it returns I sometimes see part of the image is now empty, or the fill did nothing, but undoing and refilling generally works the second time. I think your fill algorithm is both leaky and buggy. iMac (Retina 5K, 27-inch, 2017) 4.2 GHz Quad-Core Intel Core i7 16 GB 2400 MHz DDR4 Radeon Pro 580 8 GB
 -
 Hi, I would like to report several memory usage problems: 1. Publisher uses around 11GB RAM at start with simple 30 pages project with around 100 tiff/cmyk images linked (300dpi pages with size 25cm/20cm). Nothing in performance or project settings helps. Memory limit doesn't work at all, the same for other options. 2. Memory usage is increasing every time I open/close the project. See attached screenshots. Just after Publisher starts it gets 440MB, then I open project and it gets 10.8GB, then I close the project and it drops to 2.6GB (!), open again and it gets 11.7GB, close it again it drops to 3.6GB etc. I use latest 1.9.2 version, on Windows 8.1 Pro. Please, help, at this moment it is barely usable. Regards, Bogdan
-
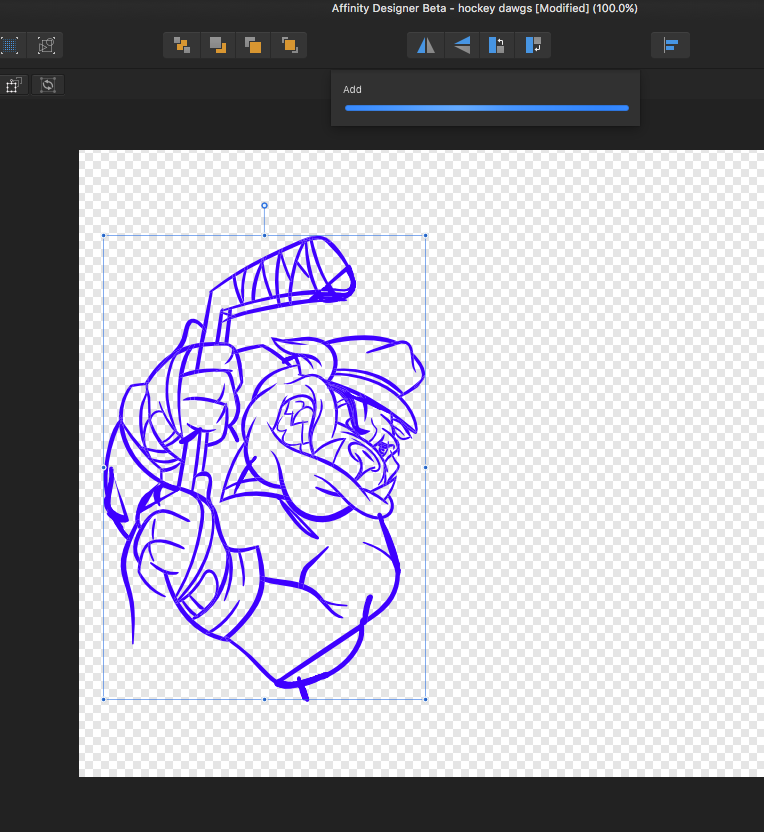
 With Affinity Designer, I'm making a visual health cue of a bipedal figure, separating the torso, arms, and legs so that each section can independently show a health status with a color. This means several copies of each section's image layer with a different color (green means 100%, red is 25%, etc). I've isolated each section with a layer mask so I have to decide between adding a Layer Effect>Color Overlay, or Adjustment Layer>Recolor (or HSL) to each group of layers, or to each individual layer. Also wondering if it's more efficient to add the layer effect or adjustment layer to the group layer or to each layer individually. I just want the program and my computer to run as smoothly as possible, been noticing the fans getting a little louder after adding a Color Overlay Layer Effect to each group. Just want to know if that's the best option or if there's a better one that's less taxing to my pc. I'm on Windows 10, with an Asus ROG laptop which has an Nvidia GTX1070 with 6 or 8 GB dedicated graphics. I've attached a pic of how I've organized the groups. I opened the 100% group so you can see what's inside each group, and all the other percent groups are organized the same.
-
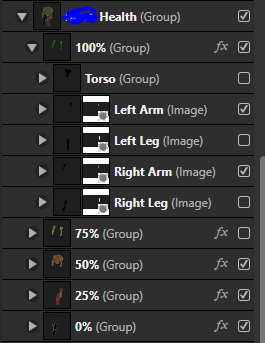
I have been playing with the newest Designer Beta and love the progress that has been made. In my inking process I use to create my designs, I use a vector brush to ink and intentionally overlap corners and edges of a design to get the line thicknesses I am looking for. I then expand the strokes and divide them in their entirety, so the overlap parts can be easily selected and deleted. I hit the add function to merge the pieces together and the divide again before a final add together so I can easily delete the massive number of extra unused nodes. (hitting "add" to combine to overlapping fills results in a massive collection of extra nodes underneath) When I go to add the parts back together for the final merge and hit the "add" function, the app sucks up a tremendous amount of RAM and freezes. I understand my 12 GB of RAM is not a ton, but I can't tell if this is an Affinity Designer issue, or if I had twice the RAM, this would be fixed?
-
 If I create mulitple objects in affinity designer the performance become slower. If I hide the objects it is faster again. How can I solve the problem? 64 GB RAM 8 GB video graphic
 -
 In the preference window it shows 32GB as allocatable RAM though I only have 16GB installed. Would be better if the program limited this option to the maximum actually available
 -
 After working intensely in a 300+ mg AD doc, certain AD functions no longer work. Quitting AD and bringing it up again solves the problem, and AD always remembers what I had just done (bravo!). I'm working with a MacPro with 24g of RAM with nothing else up except Mail. Does AD only access a limited amount of memory? Is the problem that its Undo remembers everything I've done in the session since I am manipulating many layers with hundreds of object? It may simply be a Mac memory problem. No big problem. Just wondering what the cause might be.
 -
 I did an SVG conversion on a jpeg and when I open it in Affinity my machine falls over (memory issue). Machine has 8GB Physical ram and 4GB Video ram. Weirdly, I can open the file and work with it very comfortably in Inkscape Is there anything I can tweak to avoid this issue in future? Are SVG's problematic in Affinity? Is there another format that it might play nicer with? Thanks J memory hog.svg
 -
 Is there a way to see how big a file is in memory to see why AP is becoming Beachballhalla? In the info panel I only see Memory pressure which I assume denotes read/write velocity and Memory efficiency which I have no idea what it means. Especially since it displays as over 3k% which is interesting given what per cent means. I haven't found a way yet to display the internal memory use. I can sort of guess it with iStat menus and TOP but that's the whole app, not just my file. I can't optimise the app but I can optimise the file for performance once I know what's causing what to bloat.
 -
 Photographer and computer nerd here - How does Affinity Photo process information? While making edits to raw files in the "Develop Persona", I've noticed the fans of my 2012 Retina MacBook Pro spin up like jet engines. Does Affinity Photo rely heavily on CPU speed/RAM speed or is it heavily multithreaded? Does more cores = faster responses to adjustments? or do faster clock speeds lead to faster responses? I am curious because (as I said before) my 2012 rMBP is beginning to show its age when editing the raw files I give to the Develop Persona and, with the advent of the newer MBPs, I was hoping to get an idea of what machine would be best to purchase to get the best performance with the smallest form factor without emptying my wallet completely
 -
 My pc configuration is a: Windows 7 Professional 64-bit SP1 Intel Pentium E6700 @ 3.20GHz Wolfdale 45nm RAM 8,00GB Dual Channel DDR3 @ 533 MHz NVIDIA GeForce GT 240 Manufacturer NVIDIA Model GeForce GT 240 GPU GT215 Device ID 10DE-0CA3 Revision A3 Subvendor ZOTAC International (MCO)/PC Partner (19DA) Current Performance Level Level 1 Current GPU Clock 135 MHz Current Memory Clock 135 MHz Current Shader Clock 135 MHz Voltage 0.900 V Technology 40 nm Die Size 133 mm² Release Date Nov 17, 2009 DirectX Support 10.1 OpenGL Support 4.1 Bus Interface PCI Express x16 Driver version 9.18.13.4196 BIOS Version 70.15.24.00.00 ROPs 8 Shaders 96 unified Memory 1024 MB Samsung SSD 840 EVO 500GB ATA Device Manufacturer SAMSUNG Heads 16 Cylinders 60.801 Tracks 15.504.255 Sectors 976.768.065 SATA type SATA-III 6.0Gb/s Device type Fixed ATA Standard ACS2 Serial Number S1DHNSAF508366X Firmware Version Number EXT0BB6Q LBA Size 48-bit LBA Power On Count 2391 times Power On Time 314,2 days Speed Not used (SSD Drive) Features S.M.A.R.T., NCQ, TRIM, SSD Max. Transfer Mode SATA III 6.0Gb/s Used Transfer Mode SATA II 3.0Gb/s Interface SATA Capacity 465 GB Real size 500.107.862.016 bytes RAID Type None Ok, this actual beta (RC2) - 1.5.0.26 is slower than previous one and every action I do in a project, it has a small frozen with the (not responding) tittle bar alert and after4/5 seconds it unblocked itself and do the work normally. I know that I get a low limit pc configuration, though I was curious how are the limits about my configuration
 -
 I'm curious as to how each of the items affects the applications' performance. There's no explanation in the help files. RAM Usage Limit: I notice this can be dragged up to ~64 GB (which is more than 5 times how much RAM my Mac has...); does lessening the amount keep the application running smoothly... or do I need to open it up to the maximum amt of RAM I have so that it doesn't get "bottled up"? Disk Usage Warning Limit: This one's a bit confusing--does the application warn you if there's less than the set amount when you try to save a document? Again, the max is set at 64GB, even though my hard drive has 40 GB of free space at the moment. Undo Limit: I presume that the lower I set this, the less RAM the application will need Dither gradients: faster performance checked, or unchecked? Use precise clipping: same question Use hardware OpenGL: same User only integrated GPU: same
- 8 replies
-
- 5
-

-
- preferences
- affinity designer
- (and 4 more)