Search the Community
Showing results for tags 'color matrix'.
Found 1 result
-
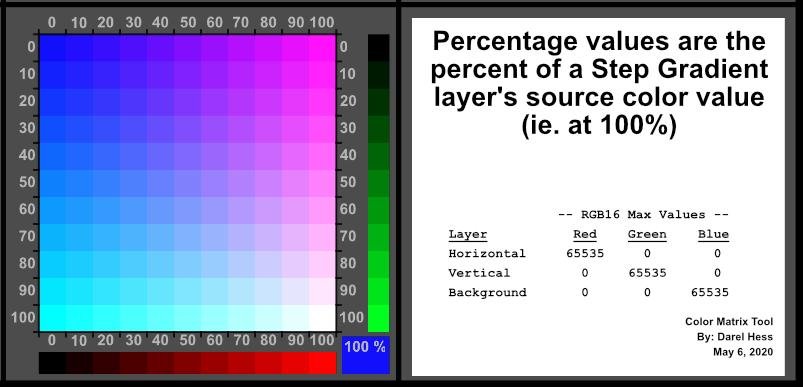
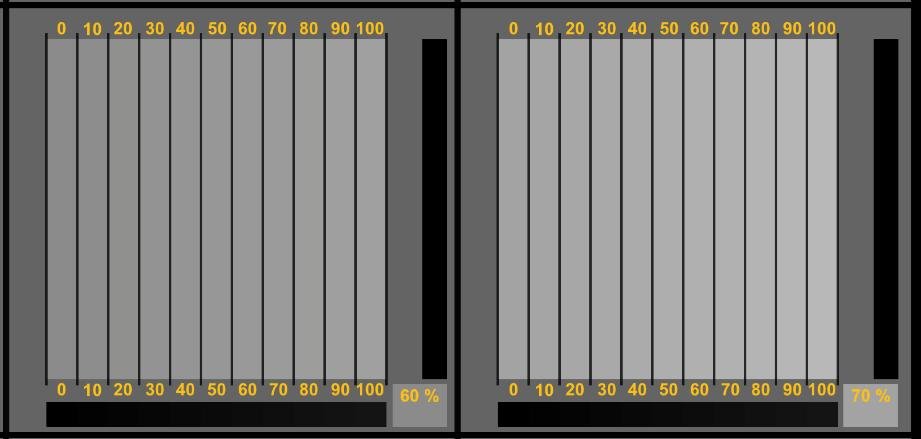
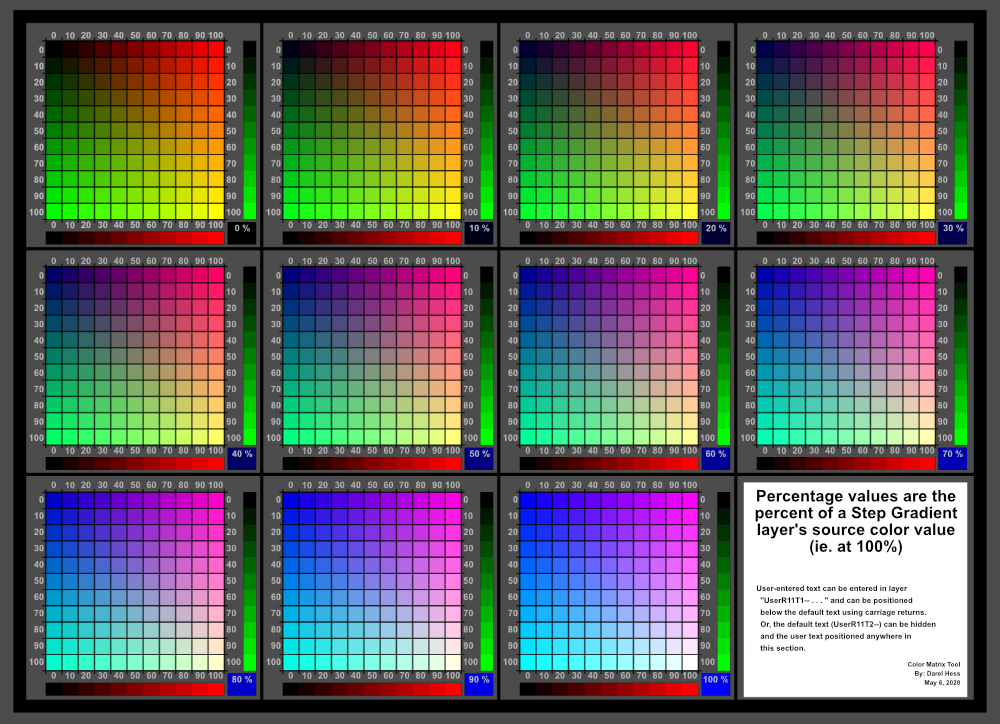
 I have developed a Photo document to be used as a Color Matrix Tool. The source document file along with instructions and sample output images are available at the link below. Source files for macros and a swatches palette are also available. The document is being shared for personal, noncommercial usage. Link: https://www.dropbox.com/sh/iotzz5qa19udz9u/AAD5mPZu0bgJyhsbmMUooCD-a?dl=0 In the following description a “color” or “color value” refers to a color made up of some combination of red, green, and blue. Each of the three individual components of the color is referred to as a “color channel”. The output of the document is an image consisting of 12 sections (see first sample image below). Eleven of the sections each contains an 11x11 matrix of cells for displaying colors. Each matrix cell is 50 pixels square. Think of each section as being a layer from a color cube with 11x11x11 cells. The user can easily create a display of 1331 cells of unique colors. It is also possible to create a RGB16 step gradient of an RGB color or a gray scale distributed across 11, 121, or 1331 steps. The 12th section is available for the user to enter text notes to accompany the display. The user specifies the colors to be varied in 10% steps horizontally and vertically within a section. The opacity of each of the colors is varied from 0 to 100% in 10% steps using layer masks. A third (background) color is user specified to be applied to all cells equally within a matrix section and is likewise varied in 10% steps between sections. The final color displayed in a cell is the sum of the red, green, and blue color channels of each of the 3 Fill layers (horizontal, vertical, and background). It is also possible to add a constant color value to any of the step gradient colors. For example, it is possible to vary a red color horizontally to go from 50 to 250 (RGB8) by assigning the constant value as 50 and the step gradient component as 200 (0-200). The possible displays lend themselves nicely to visualize and/or quantitate the effects of various Adjustment layers and of Opacity, Blend Modes, and Blend Ranges applied to: a. adjustment layers, b. superimposed pixel layers, c. superimposed fill layers, or d. output of the Color Matrix Tool. Images can be exported as PNG (retains opacity and accurate pixel values) or JPG files for sharing or using in the future without having to recreate them. I recommend that you at least do a quick of the Instructions file located in the above link at, ColorMatrixTool -- by Darel Hess\_B_Instructions_Hints____ColorMatrixTool.jpg Hope you enjoy playing with the tool. Sample image with single color channel in each of 3 fill layers. Matrix section with inner grid lines hidden. User text in section 12. Portion of a 121 step gray scale spanned across 11 sections. Note the ability to hide/show the vertical and the horizontal grid lines independently. Color of axis labels can also be set by the user. Visibility of the left, right, top, and bottom axis labels can be independently hidden or displayed.