Search the Community
Showing results for tags 'Chart'.
Found 9 results
-
 Hi guys, Can I create a pie chart from a SINGLE pie/donut tools, without duplicating them? Thank you
 -
Hi, I would like to be able to see intensity waveform, RGB parade, and Vectorscope chart simultaneously in my studio. This way, when I make an adjustment, I can see the impact on all three of them at the same time then having to toggle back and forth between each chart on scope panel.
-
Hey guys, in case someone is doing mindmaps with Affinity, like I am, these might come in handy. Arrows, pointers, actions, terminators/buttons, forms and boolean operators. mindmapping.afassets
- 5 replies
-
- 3
-

-

-
- affinity designer
- mindmapping
- (and 3 more)
-
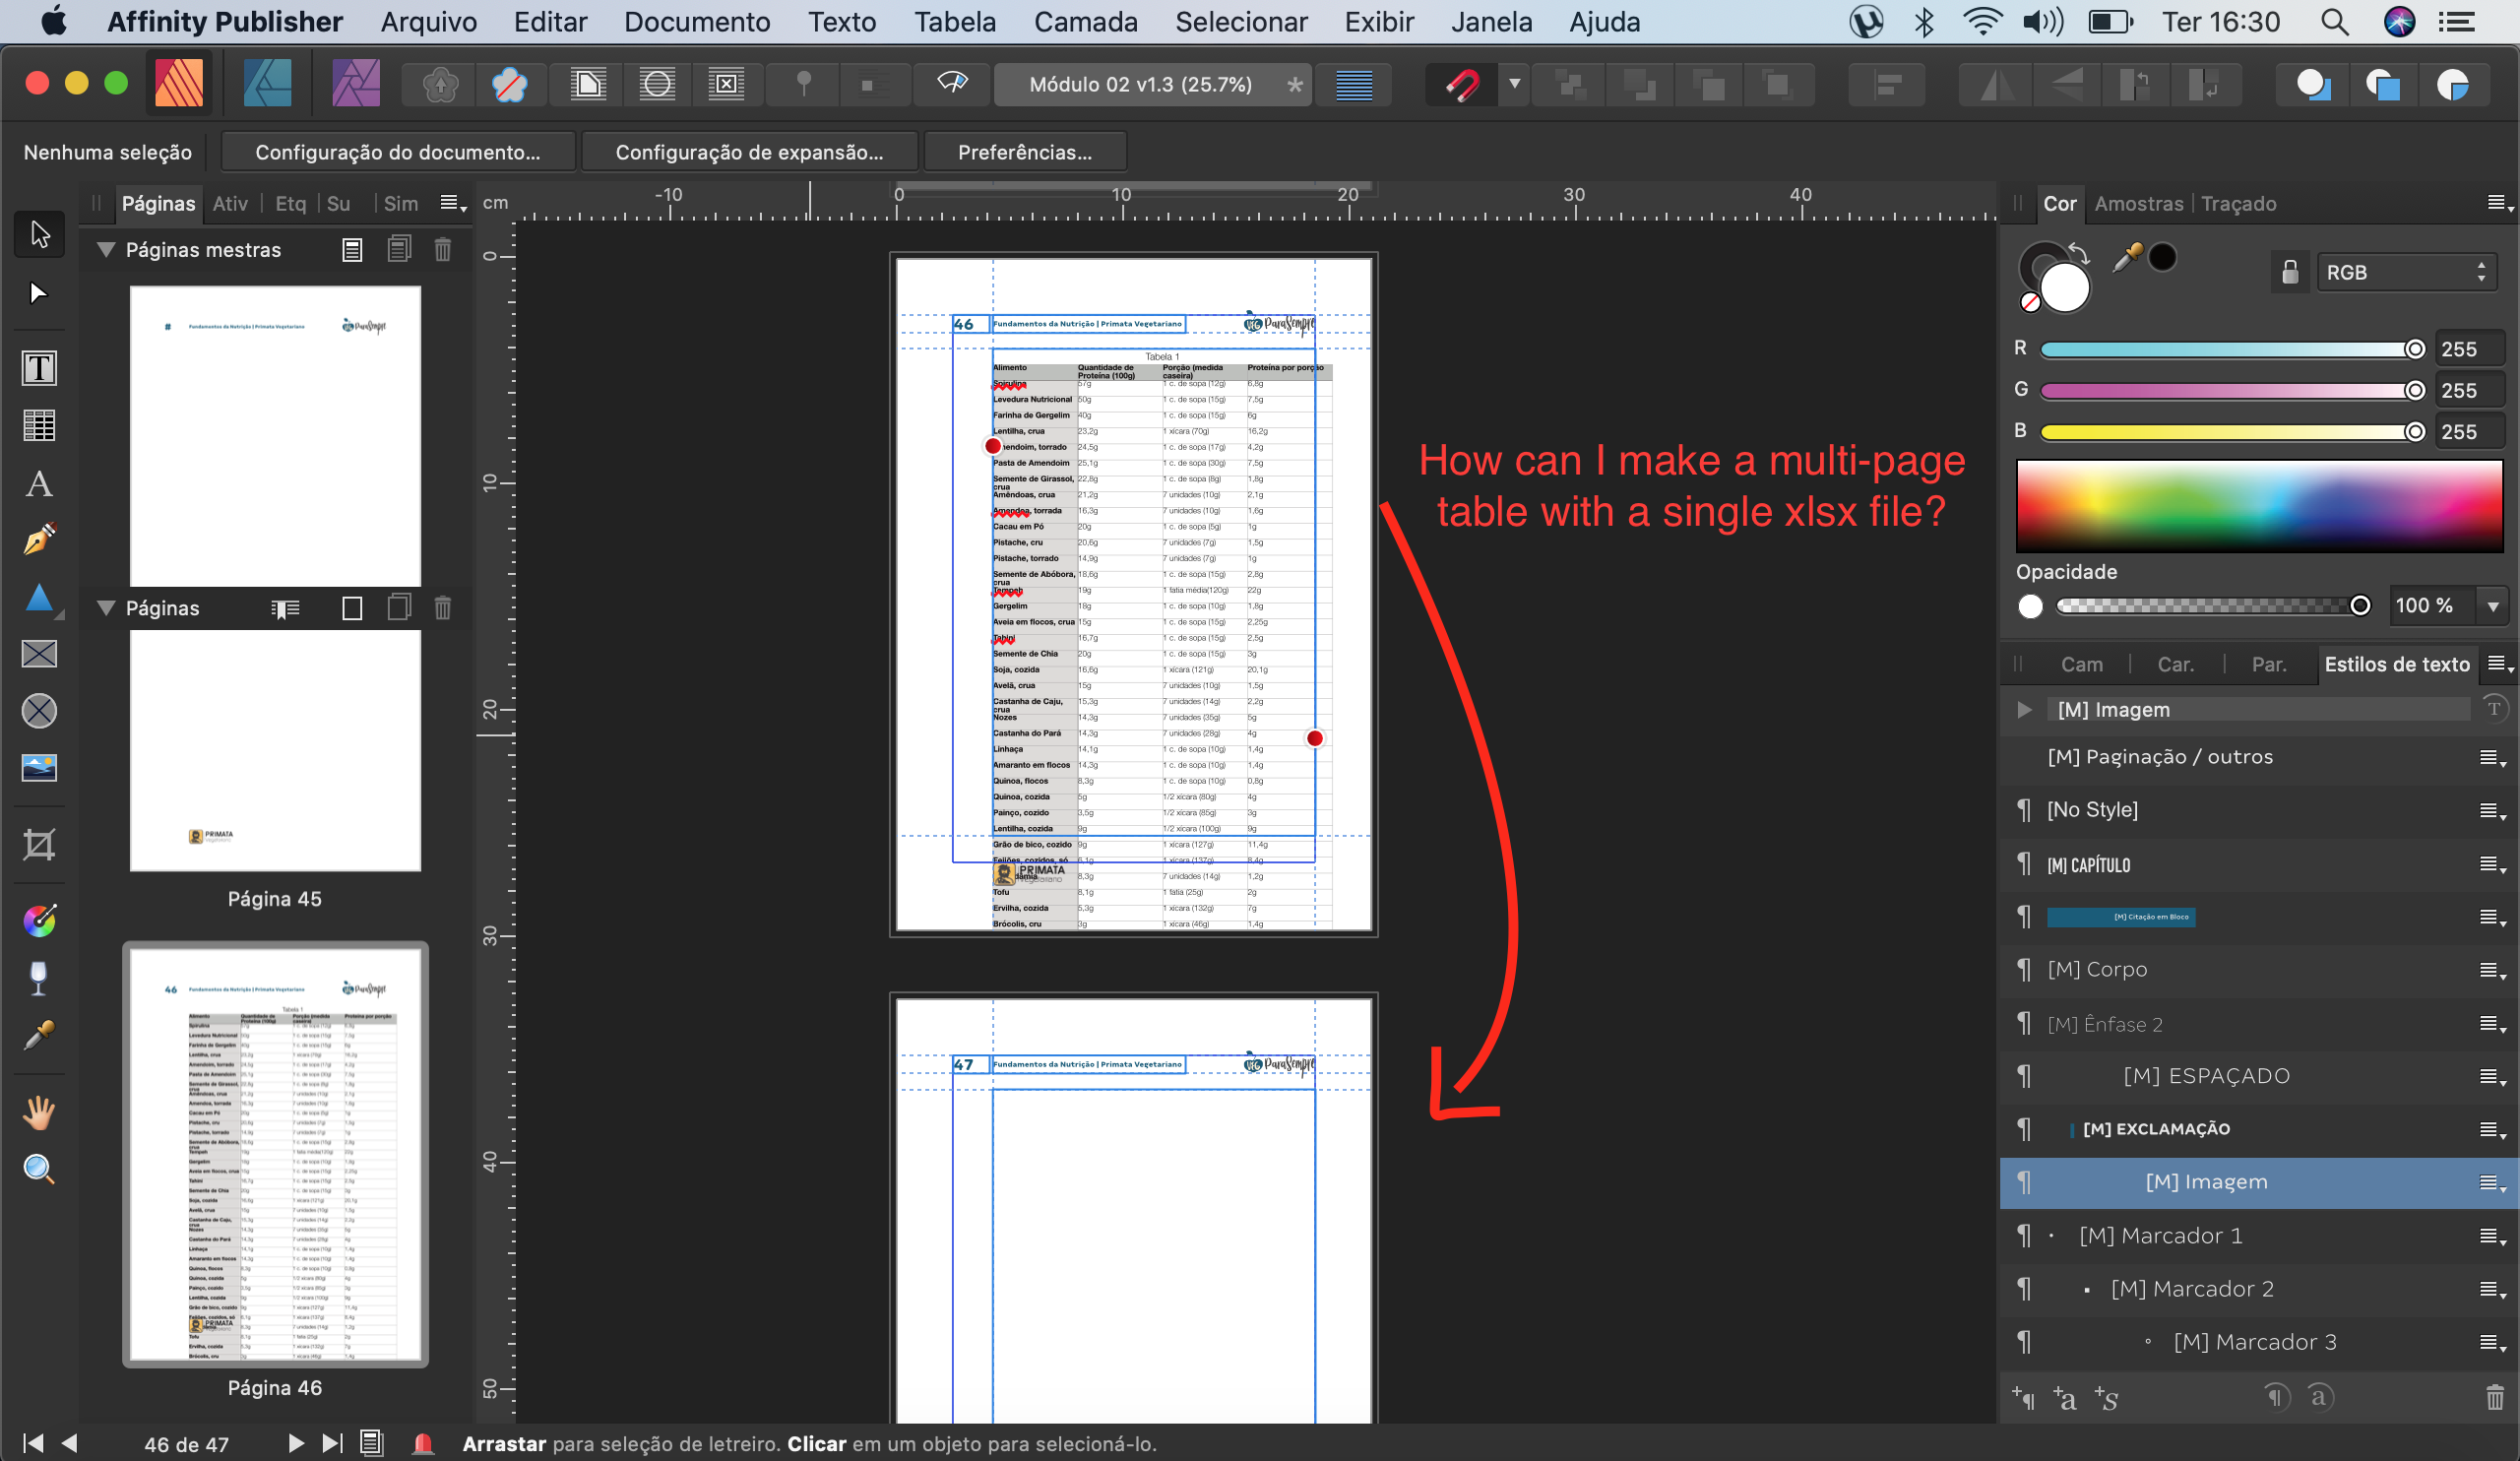
 How can I make a multi-page table with a single xlsx file? As I understand it, no matter the size of the table, I need to make it fit on the same page, because there is no function to keep it on the next page. Is it possible to make a table that is larger than one page? Affinity Publisher 1.8.3
-
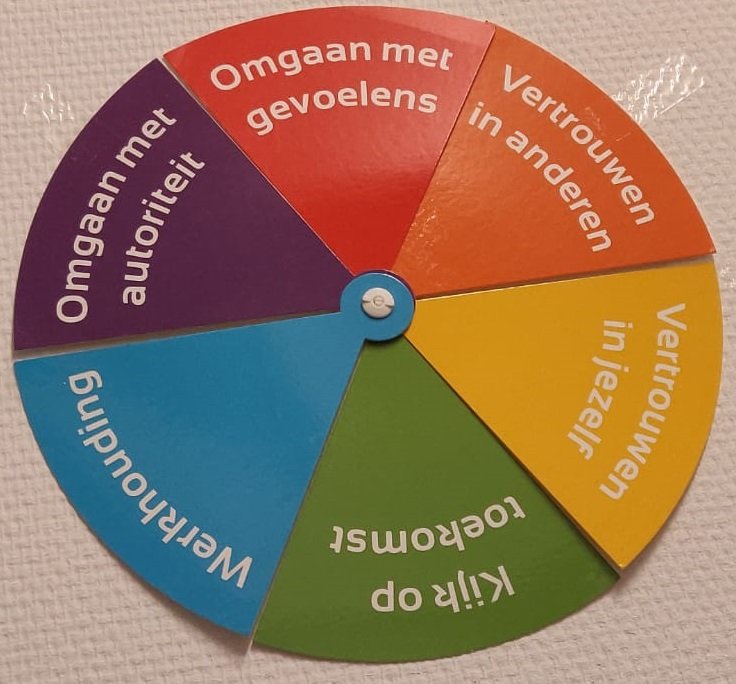
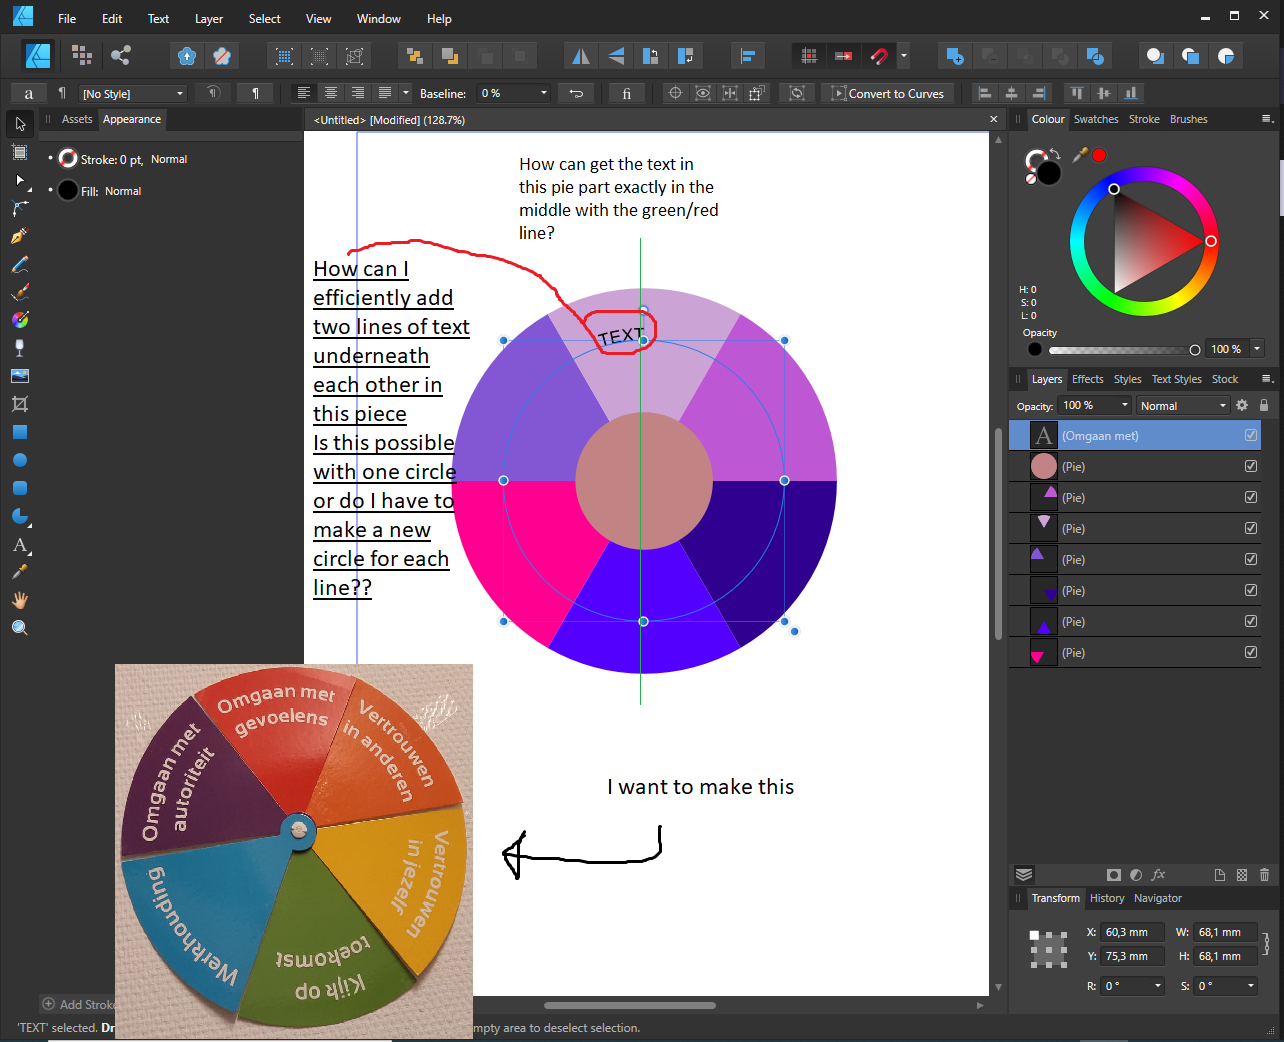
 I'm a beginner and I have a question. As shown in the picture in the appendix, I try to make a pie chart with text in the pie slices. Each pie slice should have two-line text. And of course I would like every text right in the middle of the pair. Both horizontally and vertically. I think I have to make a new circle path for every line of text and I don't know how to calibrate the middle. Perhaps there is a way to do this more practically and efficiently. Can anyone help me with this please? thank you in advance
-
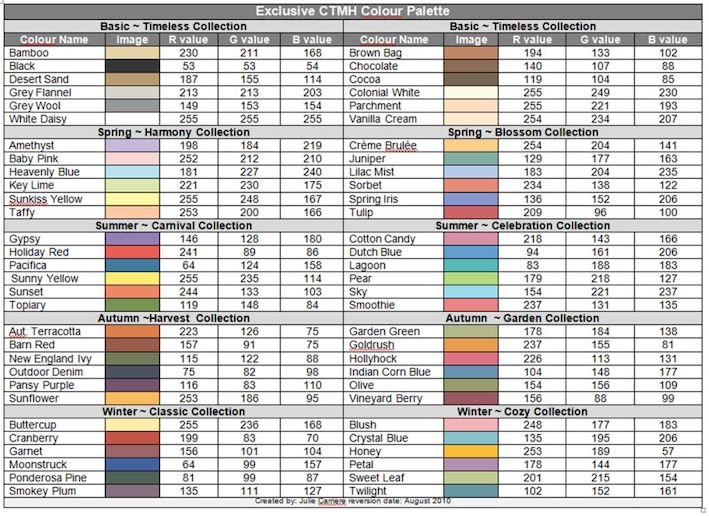
 When colorizing B&W photos to color is it possible to use CMYK and then make up a specific color using percentages? An example would be Gold= Yellow 80%, Black 20%. I've just downloaded a color chart that would be a great help if I can work with it. Emar.
-
I'm aware of the font Chartwell - but one of the few lacking tools in Affinity Designer that could justify me leaving Illustrator permanently is a Charting/Graphing tool. Illustrator's is so out-of-date and difficult to use, that introducing this tool to the Affinity apps with Affinity's lens of usability would squash any reasoning to use Adobe's tool.
-
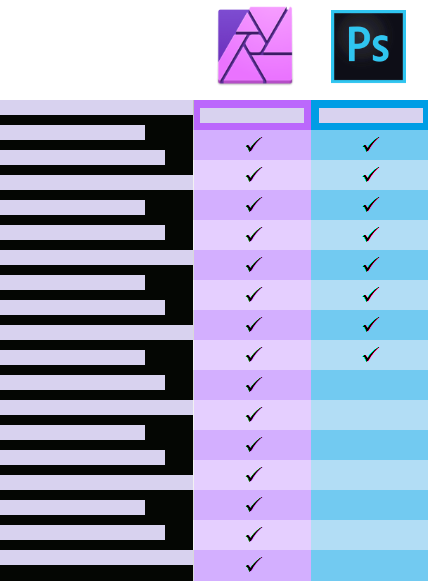
 Does anyone here have a link to or access to a feature comparison chart for Affinity Photo and Adobe Photoshop? I'm asking for a friend — really. My friend is considering either updating to a more recent version of Photoshop CC or else moving over to Affinity Photo. My talking about software is great, but I would also like to show him some resources other than my own enthusiasm. Thanks in advance.
-
After doing lot's of infographics work over the past 7 years or so, I am still not satisfied with the available tools. You have the clumsy, old-fashioned and unfinished tools in illustrator, or the playful, but rigid online tools like infogr.am. I'd love to see a truly artistic, yet highly parametric and extensible approach on infographics and charts. Any plans in that direction? Maybe as a plugin?