
Nomad Raccoon
-
Posts
27 -
Joined
-
Last visited
Everything posted by Nomad Raccoon
-
it's really not normal from a software development perspective. Also, in my case, I have top of the line hardware top to bottom, some of the fastest RAM and SSDs on the market, yet my performance is the same as anyone else's - slower than a few years ago. That means that not only the app is worse, they also don't take advantage of any hardware you may have in the first place.
-
Regarding OpenCL and how "useful" it is - I also recommend searching a bit on the forums. My benchmarks have the same score with or without OpenCL enabled btw, proving once again the rasterization performance in Affinity Photo have nothing to do with using your hardware besides single core CPU speed.
-
Hey there! First of all thanks @WMax70 for the settings, I've just tested them, and besides the auto to Gen4, the other two were already disabled in my case. There is no improvement on any benchmark in my case with these new settings. Regarding my score, I should also mention at this time I'm using the MSIX version of Affinity which has much worse benchmark scores than the MSI installer version. This was documented in other threads where I've been active, if you are interested in that, just look at my other posts/replies. Current standing theory is that MSIX is at least 20-25% slower in the benchmark. The only reason I am using MSIX is that the Affinity Photo startup lags a bit LESS on MSIX version. MSI version pretty much hangs very hard when you run the program, mostly due to the dumb way it reserves Video Memory from the OS - something I've mentioned before in my posts, but was obviously disregarded by the developers, but it's also easy to test using an advanced Process Lasso or other process management software. I'm glad the software works good for the Apple users at least, but in the X86 world the OpenCL is the biggest joke possible in terms of performance. Affinity can't even use 10% of my GPU power because all it does is rasterize and use 1 render thread and 1 process thread. There is some rudimentary multithreading on the CPU side I think, but the GPU is dormant. That's right boys and girls, that's what Canva bought in 2024, aren't they in for a treat
-
@WMax70 care to share the BIOS settings you changed, I'm curious to try them on my 5950x since my CPU results seem meh. I assume you used PBO?
-
Nvidia 4090, AMD 5950x, 64 GB RAM. My CPU is half asleep during these benchmarks, no idea why. And one more year down the road, and my GPU still lays unused by Affinity suite. One would imagine they would implement the usage of Nvidia GPUs by now.

-
No clue, I'd love to have a normal crop function too
-
Yes, but everything else is still true. It’s faster only marginally from end user perspective, and around 15-20% faster from the synthethic benchmark perspective. It still hangs when it loads anything, hangs when the app starts up, freezes from time to time and crashes sometime as described initially. Mind you most of these were not problems in V1, or to a much smaller extent ( hangs especially )
-
Hi, I specifically said there are no crash reports generated, I am aware of the folders. Last one is from March in my case, not related to this imo. If i disable hw acceleration I might as well quit altogether . This software uses less than 10% of my 4090 as it is, I don’t want to use my cpu exclusively working with high megapixel images. It’s very slow as it is. See my other posts in the benchmark threads, bug reports on slow msix version etc. only 1 , maximum2 cpu (very rarely) threads are used of the 32 available. I consider this a bug in itself, can’t call this a feature. I’d like the software to use my hardware, not crash and fall back on cpu emulation. How about Cuda support in 2023? I won’t say Optix that’s asking too much. All the best, Your neighbourly Raccoon
-
any developer insight on this issue? Has anyone acknowledged the big performance disparity? And perhaps some insight on why there are only 1-2 cpu core threads being used by the app?
-
2 crashes like this in the past 24 hours, no crash dump in affinity to upload. Windows 11,rtx 4090, latest drivers, clean install, doubt it's linked to that, the app just folds into itself like a small black hole. GPU errors leave traces 9/10 times.
-
I honestly uninstalled the sanded version as soon as I could, but I ran tests in the unsanded one, and it looks fine. I am willing to guess that i will still have the same variance as Debra above, as that was the case with older benchmark versions as well. One thing I want to note: the unsanded version does not have "hiccups" in using the app. Random freezes basically are present in the sandboxed app. That's the main reason I was on this thread to begin with. That and the really poor performance zooming in and out of regular images - this last part was fixed after fiddling with my own computer, but the freezes remained until I switched to this unsandboxed version. I think the sandboxed version is just unable to use system resources in the same way as the other one, there is no other explanation for what we are seeing.
-
Yes and both should be using OpenCL. Meaning the OpenCL implementation is really shoddy in Affinity. Can we get a mod/dev to explain this??
-
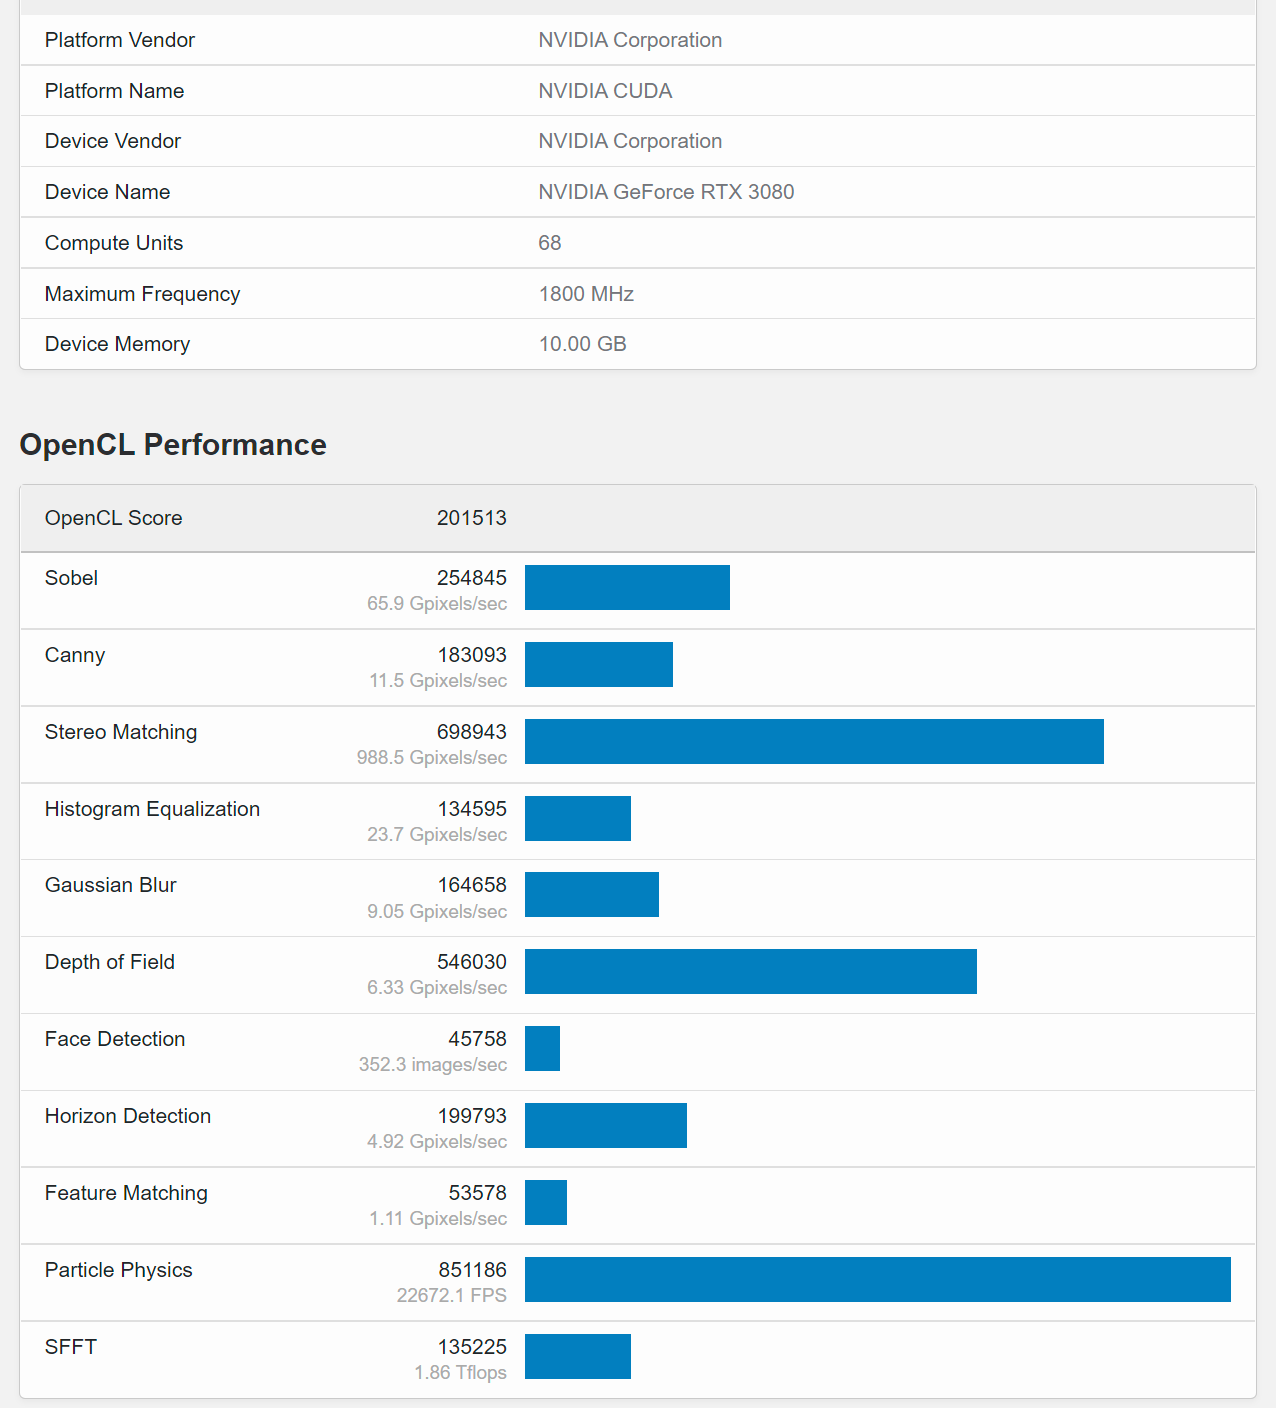
Hey @rvst My 3080 scored 201513 score , safely ranks in the 3080TI range of the Geekbench open cl benchmark. Probably because I thermally modded it myself, and it's OC-ed nicely, but geekbench does not really stress it either to be honest. (max tdp 258w, barely 70% load) I might have some time in the weekend to properly test the CPU part of the geekbench as well, but that will require at least a Curve Optimizer run.
-
Back when CUDA was working on MacOS, it was doing pretty good, I don't know what to say https://community.adobe.com/t5/premiere-pro-discussions/shock-result-opencl-vs-cuda-vs-cpu/td-p/7354875 This seems like one of those arguments on hardware, not on performance of said hardware. Issue at hand is we have plenty to work with, and no software to work it.
-
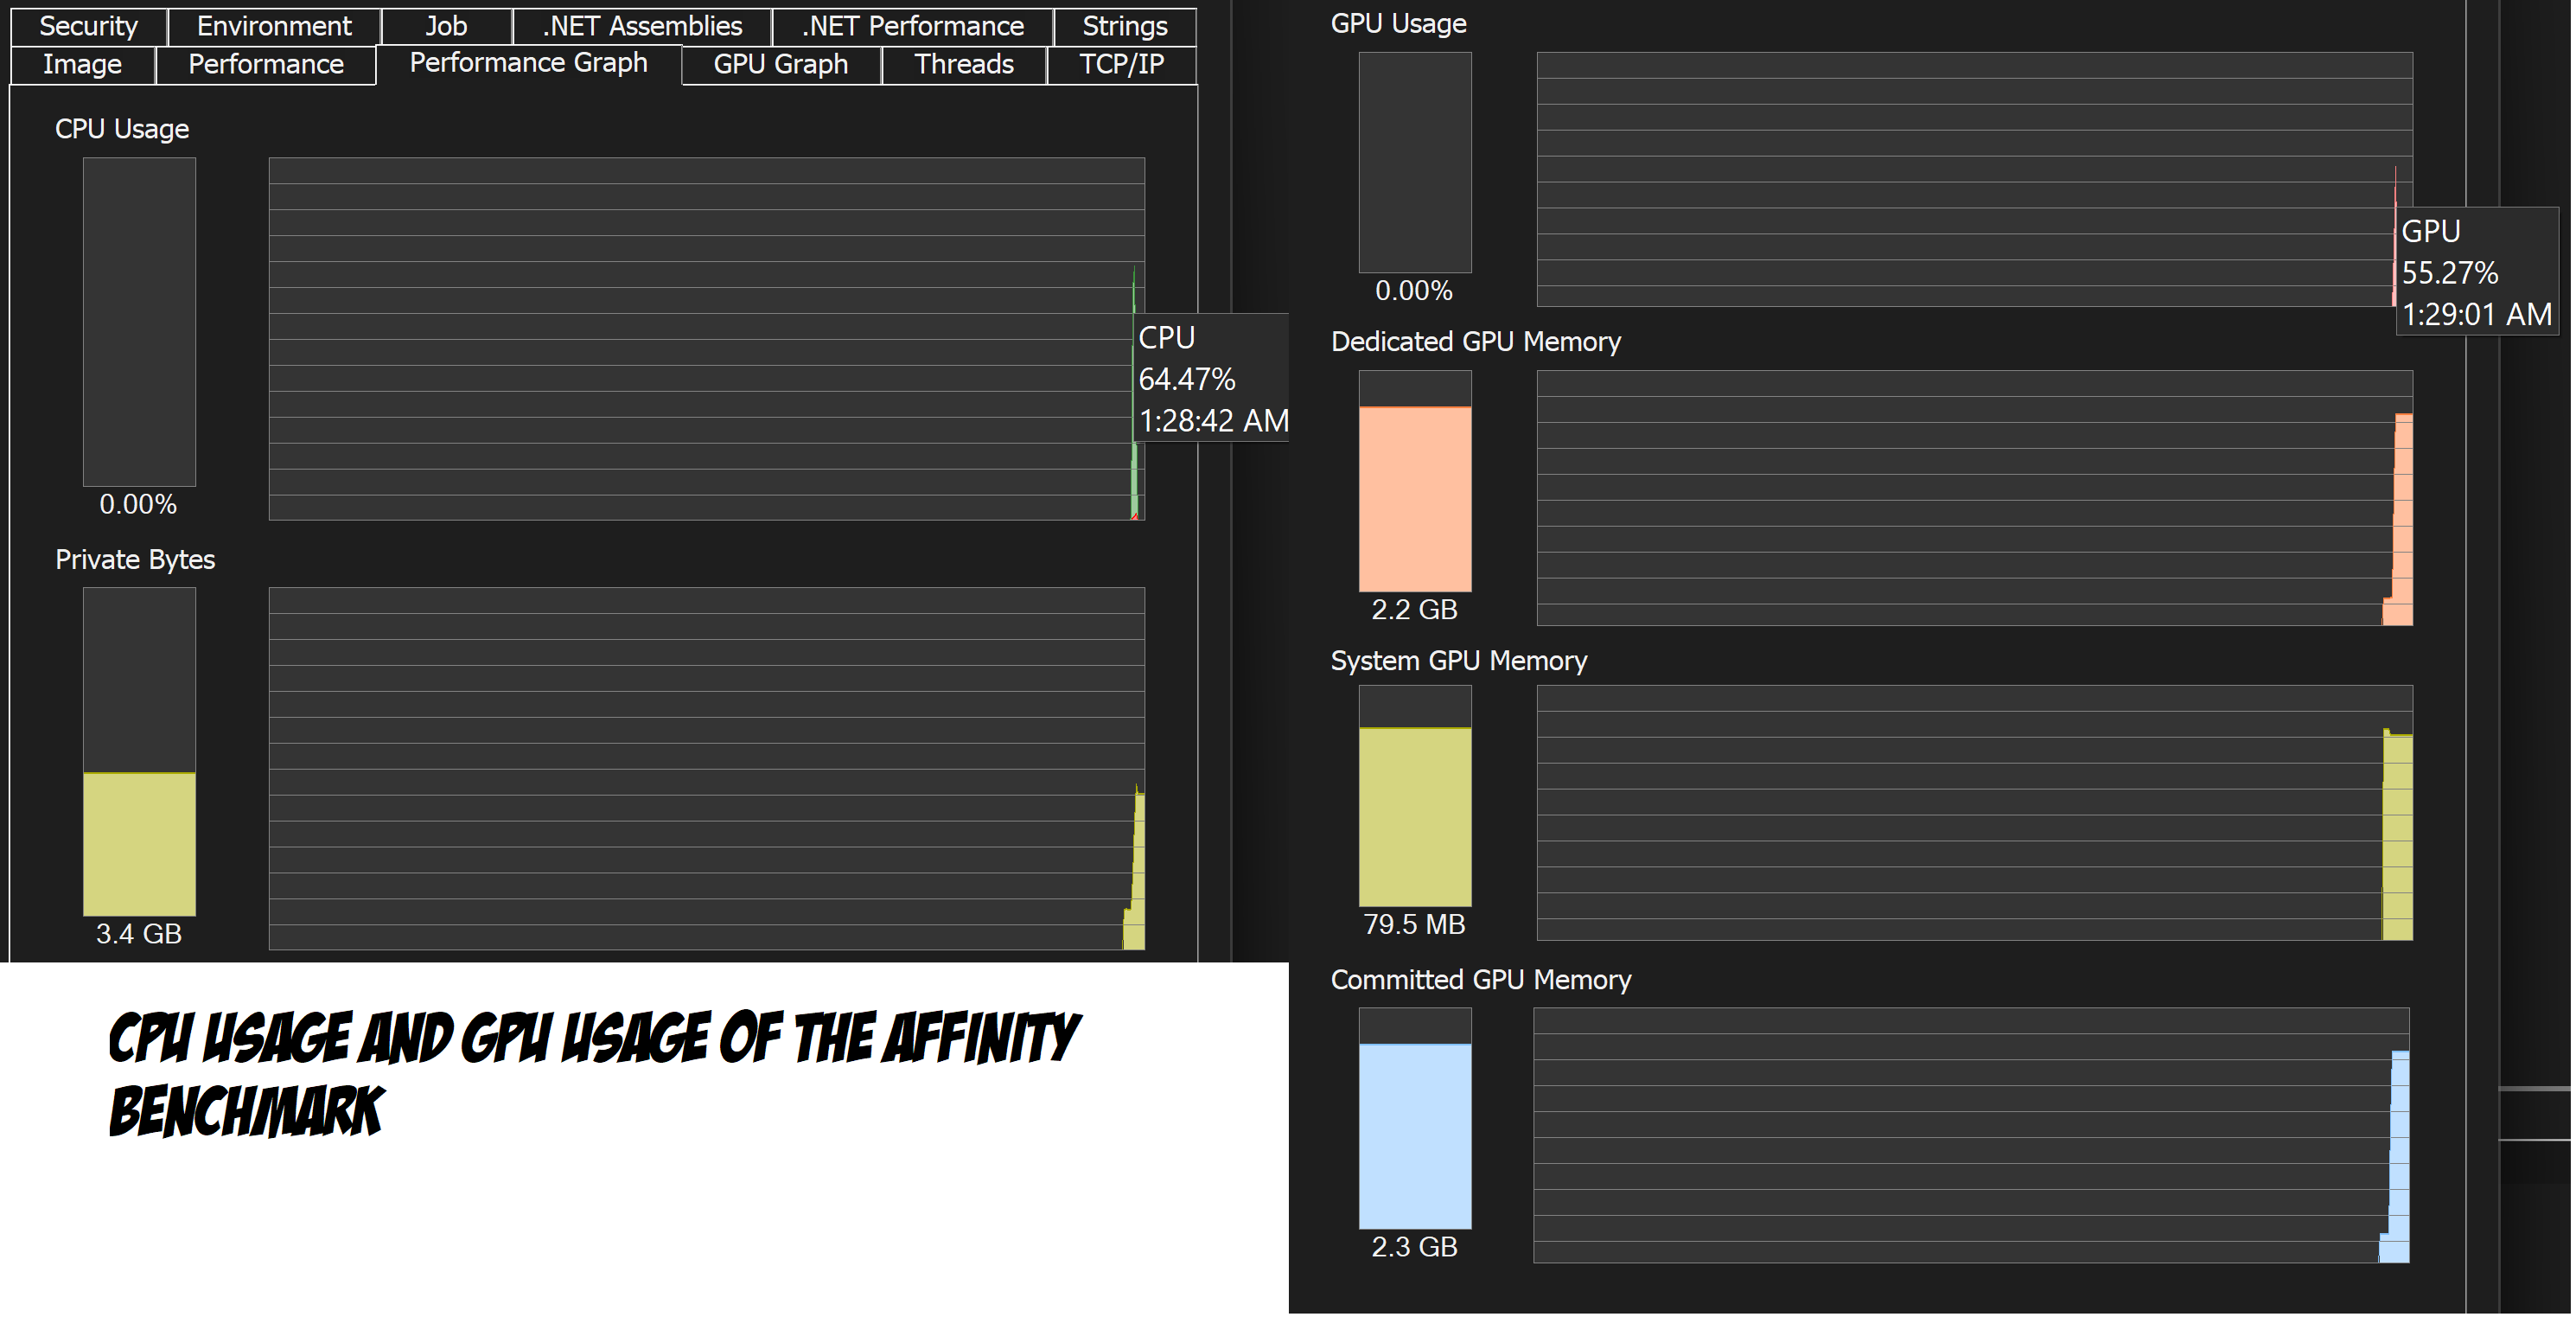
Also, what happened to CUDA guys? Is it verboten? Why isn't CUDA a thing in Affinity? And don't tell me it's a complete rewrite of the app, cause it's not. PS: regarding the cores, i have posted a graph showing the benchmark only using 50% of CPU power, and 60% of my GPU. And that's A BENCHMARK. Usual app usage is 5-10%
-
Second this, for a rework of the app it seems just as bad if not worse performance for Windows based systems, Amd especially. But my 3080 is barely used, my cpu is barely used. And the savants on the thread are discussing UMA on Apple when Infinity Fabric is literally staring them in their face along with Pci 4.0 x16 . It doesn’t take a geekbench to realize this app is currently aimed to perform only at macs/ios? Will Serif do anything about this or not?
-
In fact, I have a X570 Aorus Master motherboard, it’s all pcie 4.0, even the the ssds. I didn’t OC my Cpu that hard- i think it’s default PBO atm, then again 5950x doesn’t OC thaaat much tbh. I will check if going around 5ghz single core changes things but it’s still a silly test if you look at the cpu/gpu usage of the test. The variance in results also supports this.
-
Mine's pretty damn clean and running pretty high frequencies on everything. It would ace any other benchmark you can throw at it. There is a lot of variance in the results first of all, I can repeat the test and get pretty wild values from one run to another, even they mention we should average them. But that's not my problem here, it's the fact that the software runs SLOW, and gpu-z confirms that the GPU is not being used, while process explorer is telling me that both GPU and CPU are not used at all. It barely reaches a 70% peak on CPU during the benchmark. The test is over before it even starts as far as I see. Same for GPU. Maybe MacOS handles this faster, but besides that I see absolutely no reason why these tests would mean anything at this point.
-
Well that's easy to verify, just find someone with a different GPU and run an older benchmark, but I doubt ONLY that one test would have its score halved, it would impact the Combined GPU scores too, wouldn't it?
-
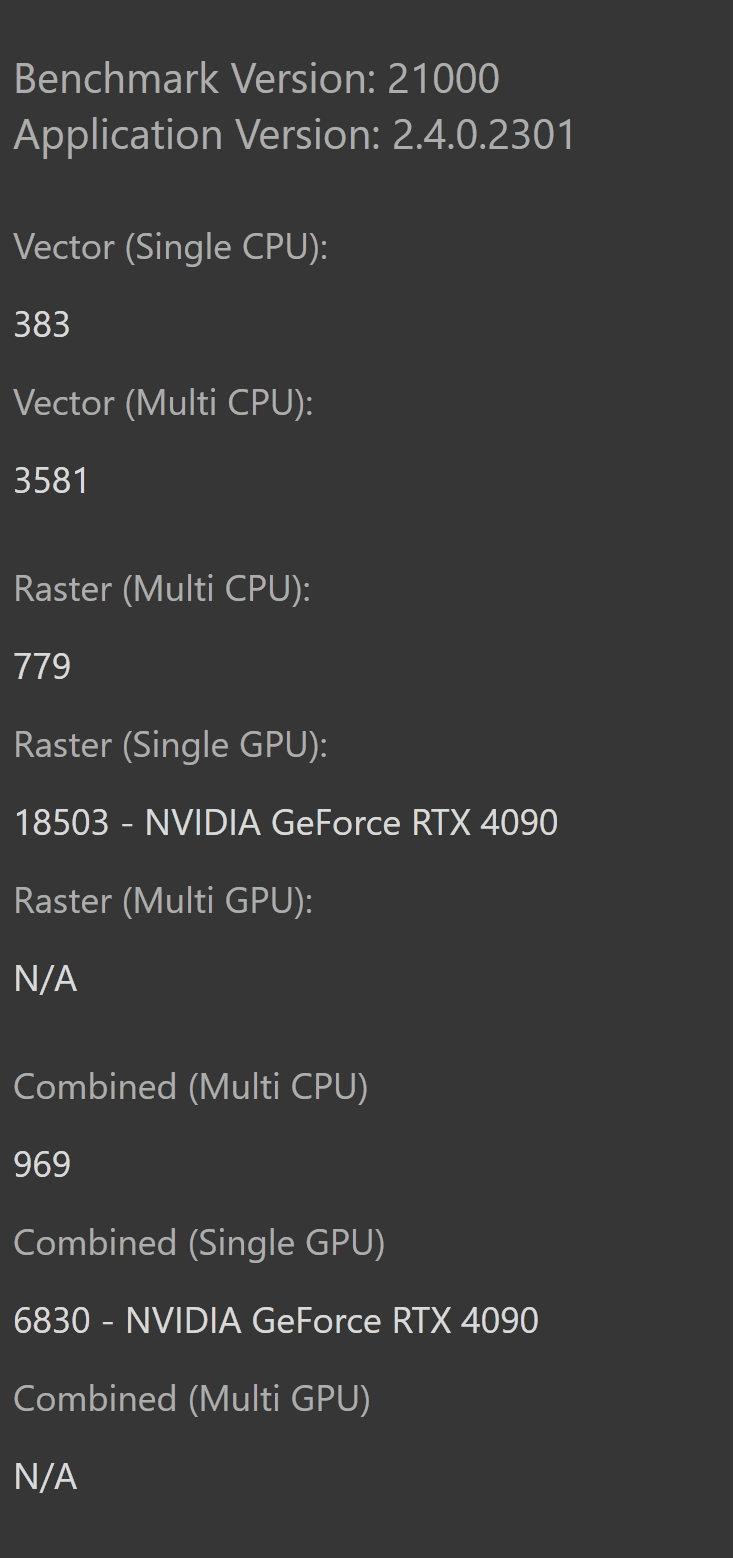
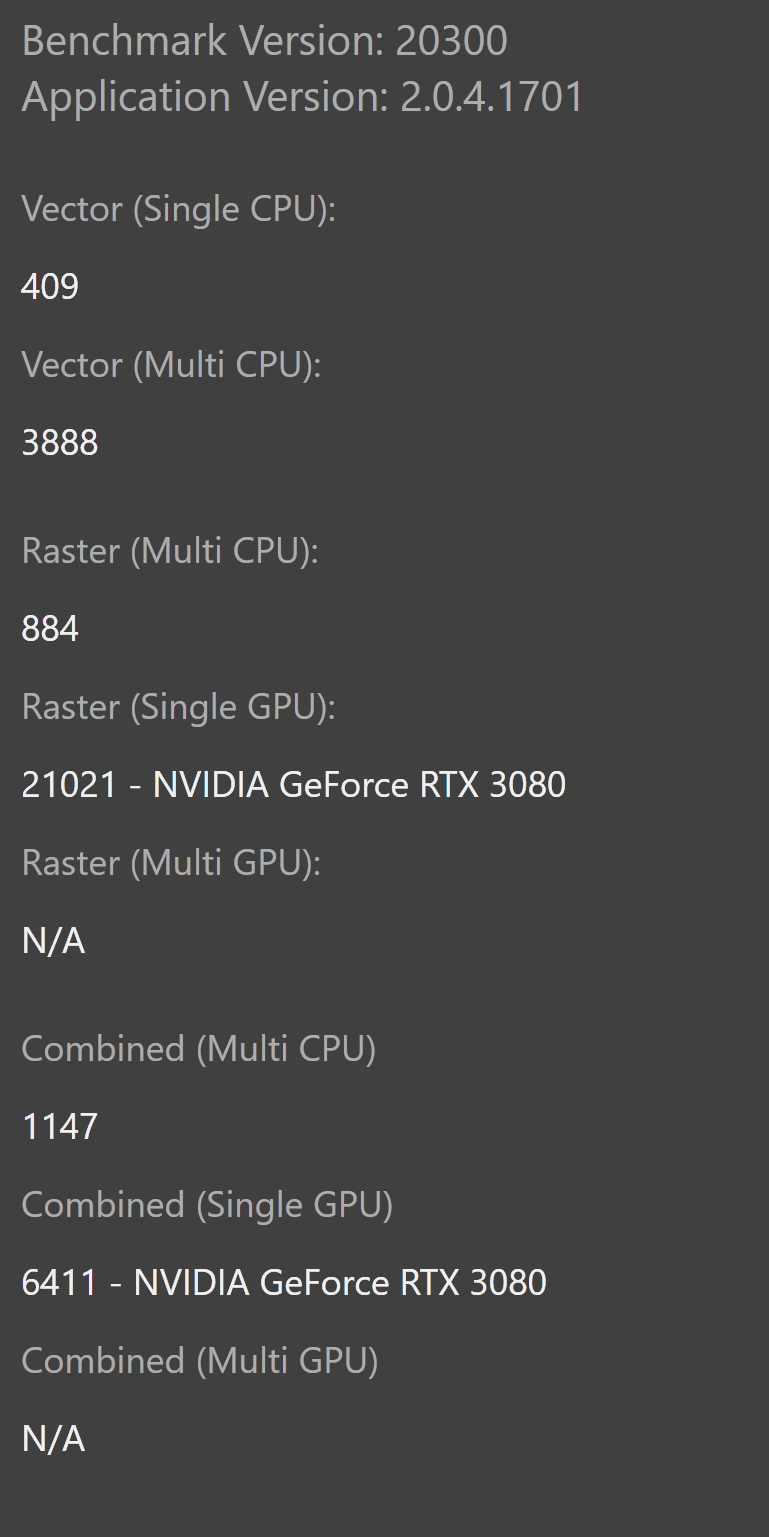
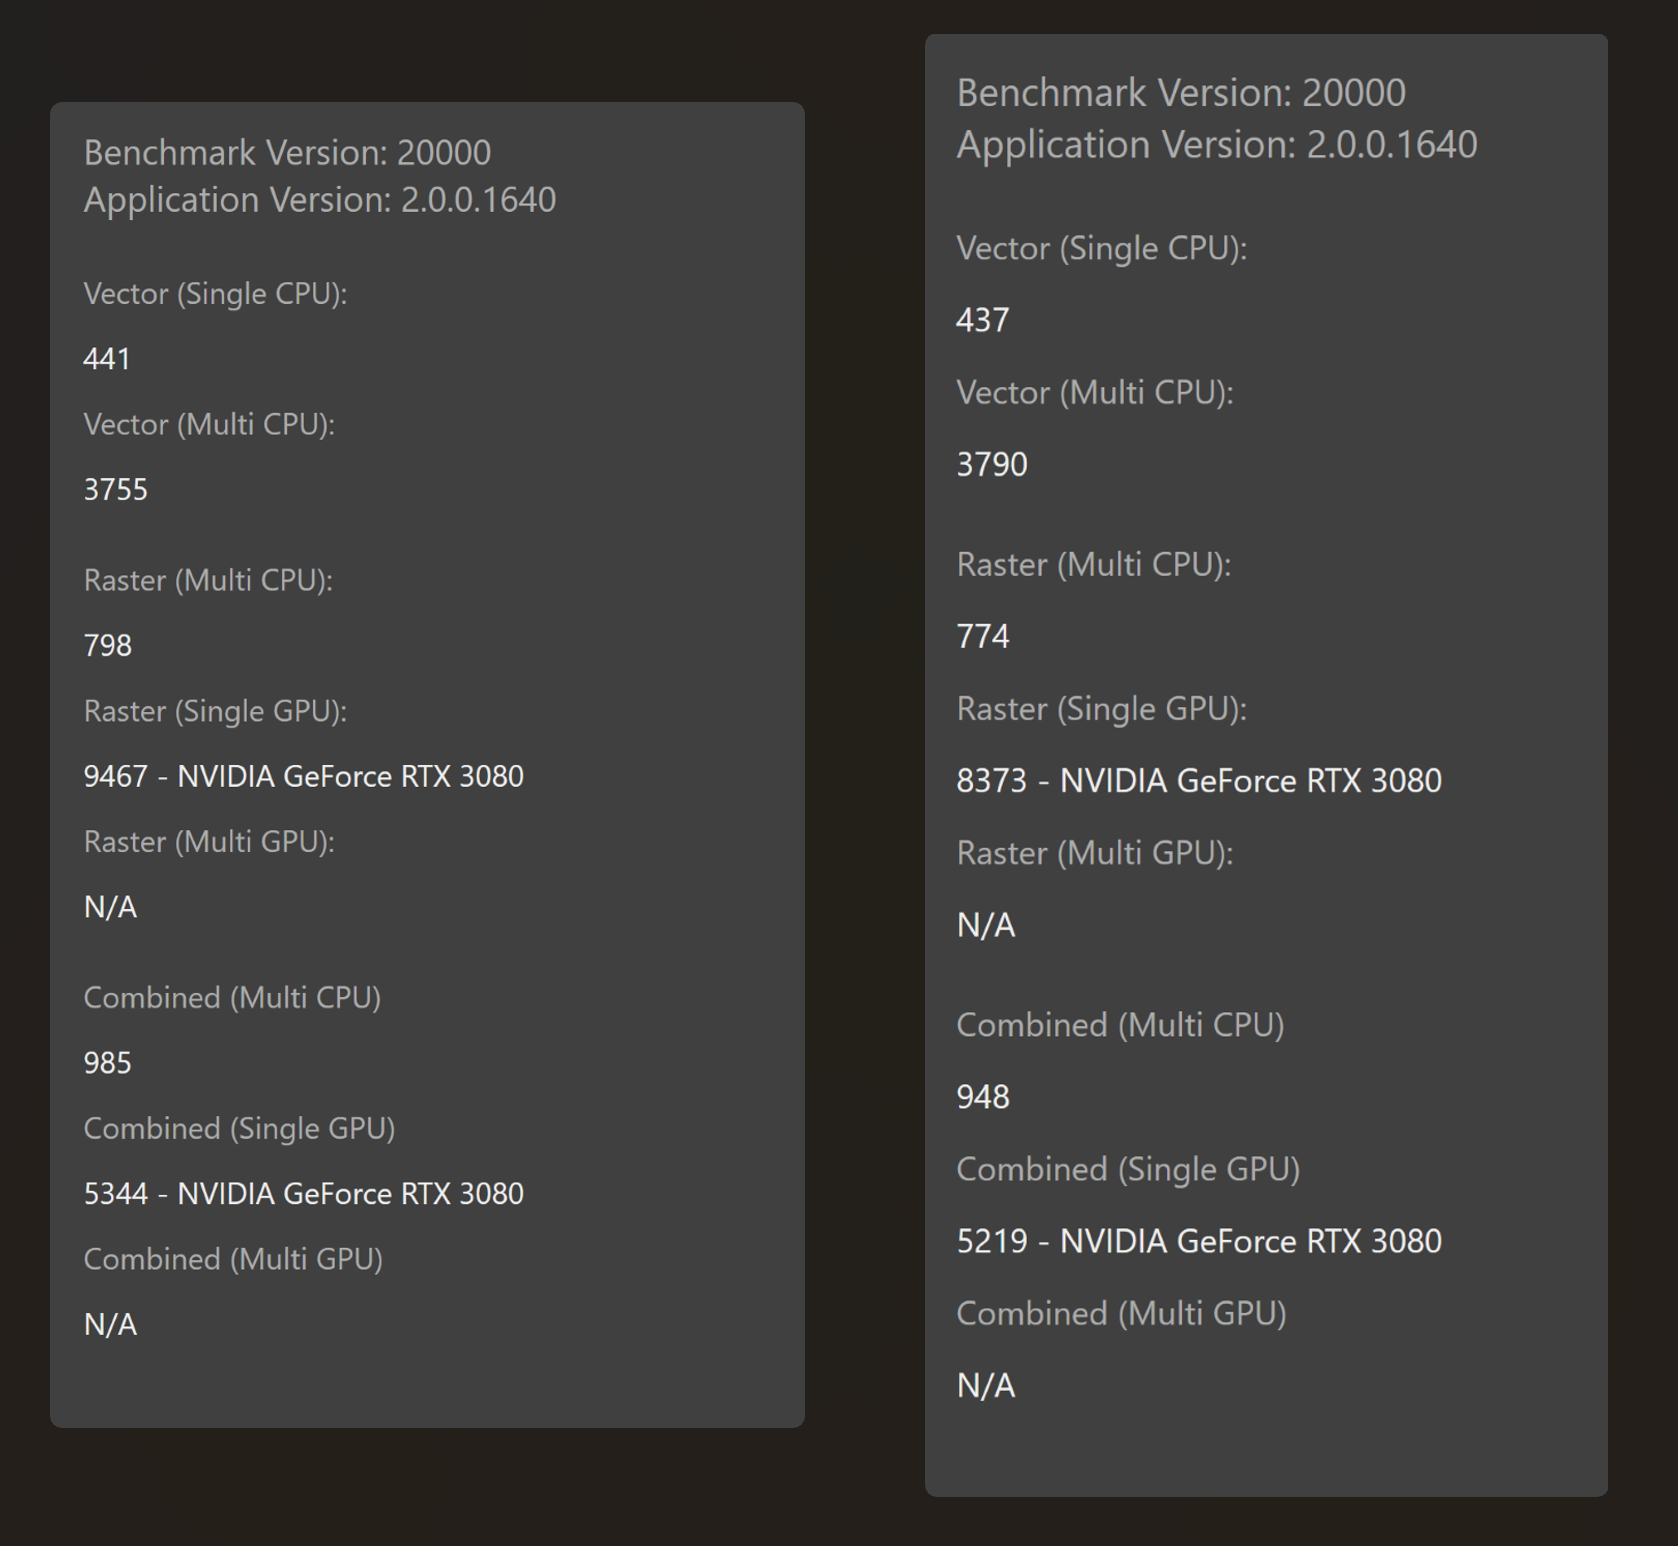
Yeah I've restarted and added my normal settings, results remain similar : Multi CPU is lower in unsandboxed, but every other result is higher, by up to 20% higher in the case of GPU raster. I see the same trend in Vector Multi CPU results for @debraspicher . What I don't understand is how someone with a 3070 reach a higher score on this benchmark version than we do with our 3080. And more interestingly how did someone reach 22372 score with a 3080 in 11021 Benchmark version and we can only reach 10-12k in version 20000.
-
Did 2 quick tests - left is UNSANDBOXED ---------------------------------------------------------- SANDBOXED Both results worse than earlier but the difference is clear on GPU, even on combined. Sandboxing hurts the performance. And tbh overall something is clearly wrong as 3080 should be doing twice those raster numbers right? I think there was an example unsandboxed with around 20k for raster - simple GPU. I still believe UWP is only part of the problem, as I initially suspected.
-
UWP apps are horrible, and my hunch was correct regarding msix, thanks for the tip for how to unsandbox them.
-
Yeah okay, that pretty much confirms what everyone was expecting, GPU is not used at all in Affinity atm lmao.
-
I am pretty much 95% sure at this point, since I was getting WHEA 117 kernel errors in the benchmark with HDR on. I haven't seen those in a long time. Anyway, my biggest confusion is the combined scores, they are all over the place, some have way older hardware and better combined scores, to me that yells bad optimization somewhere?
-
I don't know what to say. Perhaps you are right, my guess is my results are better than other RTX 3080 or 5900/5950x here also because my ram is 3600 CL14 but some other people have 3600 too, and if only the timings account for 2x difference in some scores, it's pretty nuts, isn't it?